
Not as loose as it looks
How the record 2026 solar buildout is biasing the weekly supply-demand balance — and how that effect will change through the year

Gas is on the margin in power generation more than any other fuel, meaning gas demand is highly sensitive to underlying power-market trends, including load growth, coal retirements, and renewable development. The 2025 One Big Beautiful Bill Act accelerated the phaseout of the 2022 Inflation Reduction Act’s tax credits for wind and solar development. The tax credits, originally slated to last into the 2030s, now require projects to be either in service by year-end 2027 or under construction by mid-2026.
As a result, future renewable capacity development will likely decelerate. Still, momentum from projects already under construction points to a record ~32 GW of solar capacity coming online this year, reshaping the daily and seasonal call on gas-fired generation. Backward-looking adjustments to the gas supply-demand balance don't capture this shift, which means the industry risks reading seasonal effects as structural — and structural effects as seasonal. The rising solar share of renewable capacity means the gas market will look more bearish than it is in late spring and early summer, and much tighter than it is around the winter solstice.
Wind and solar capacity outlook
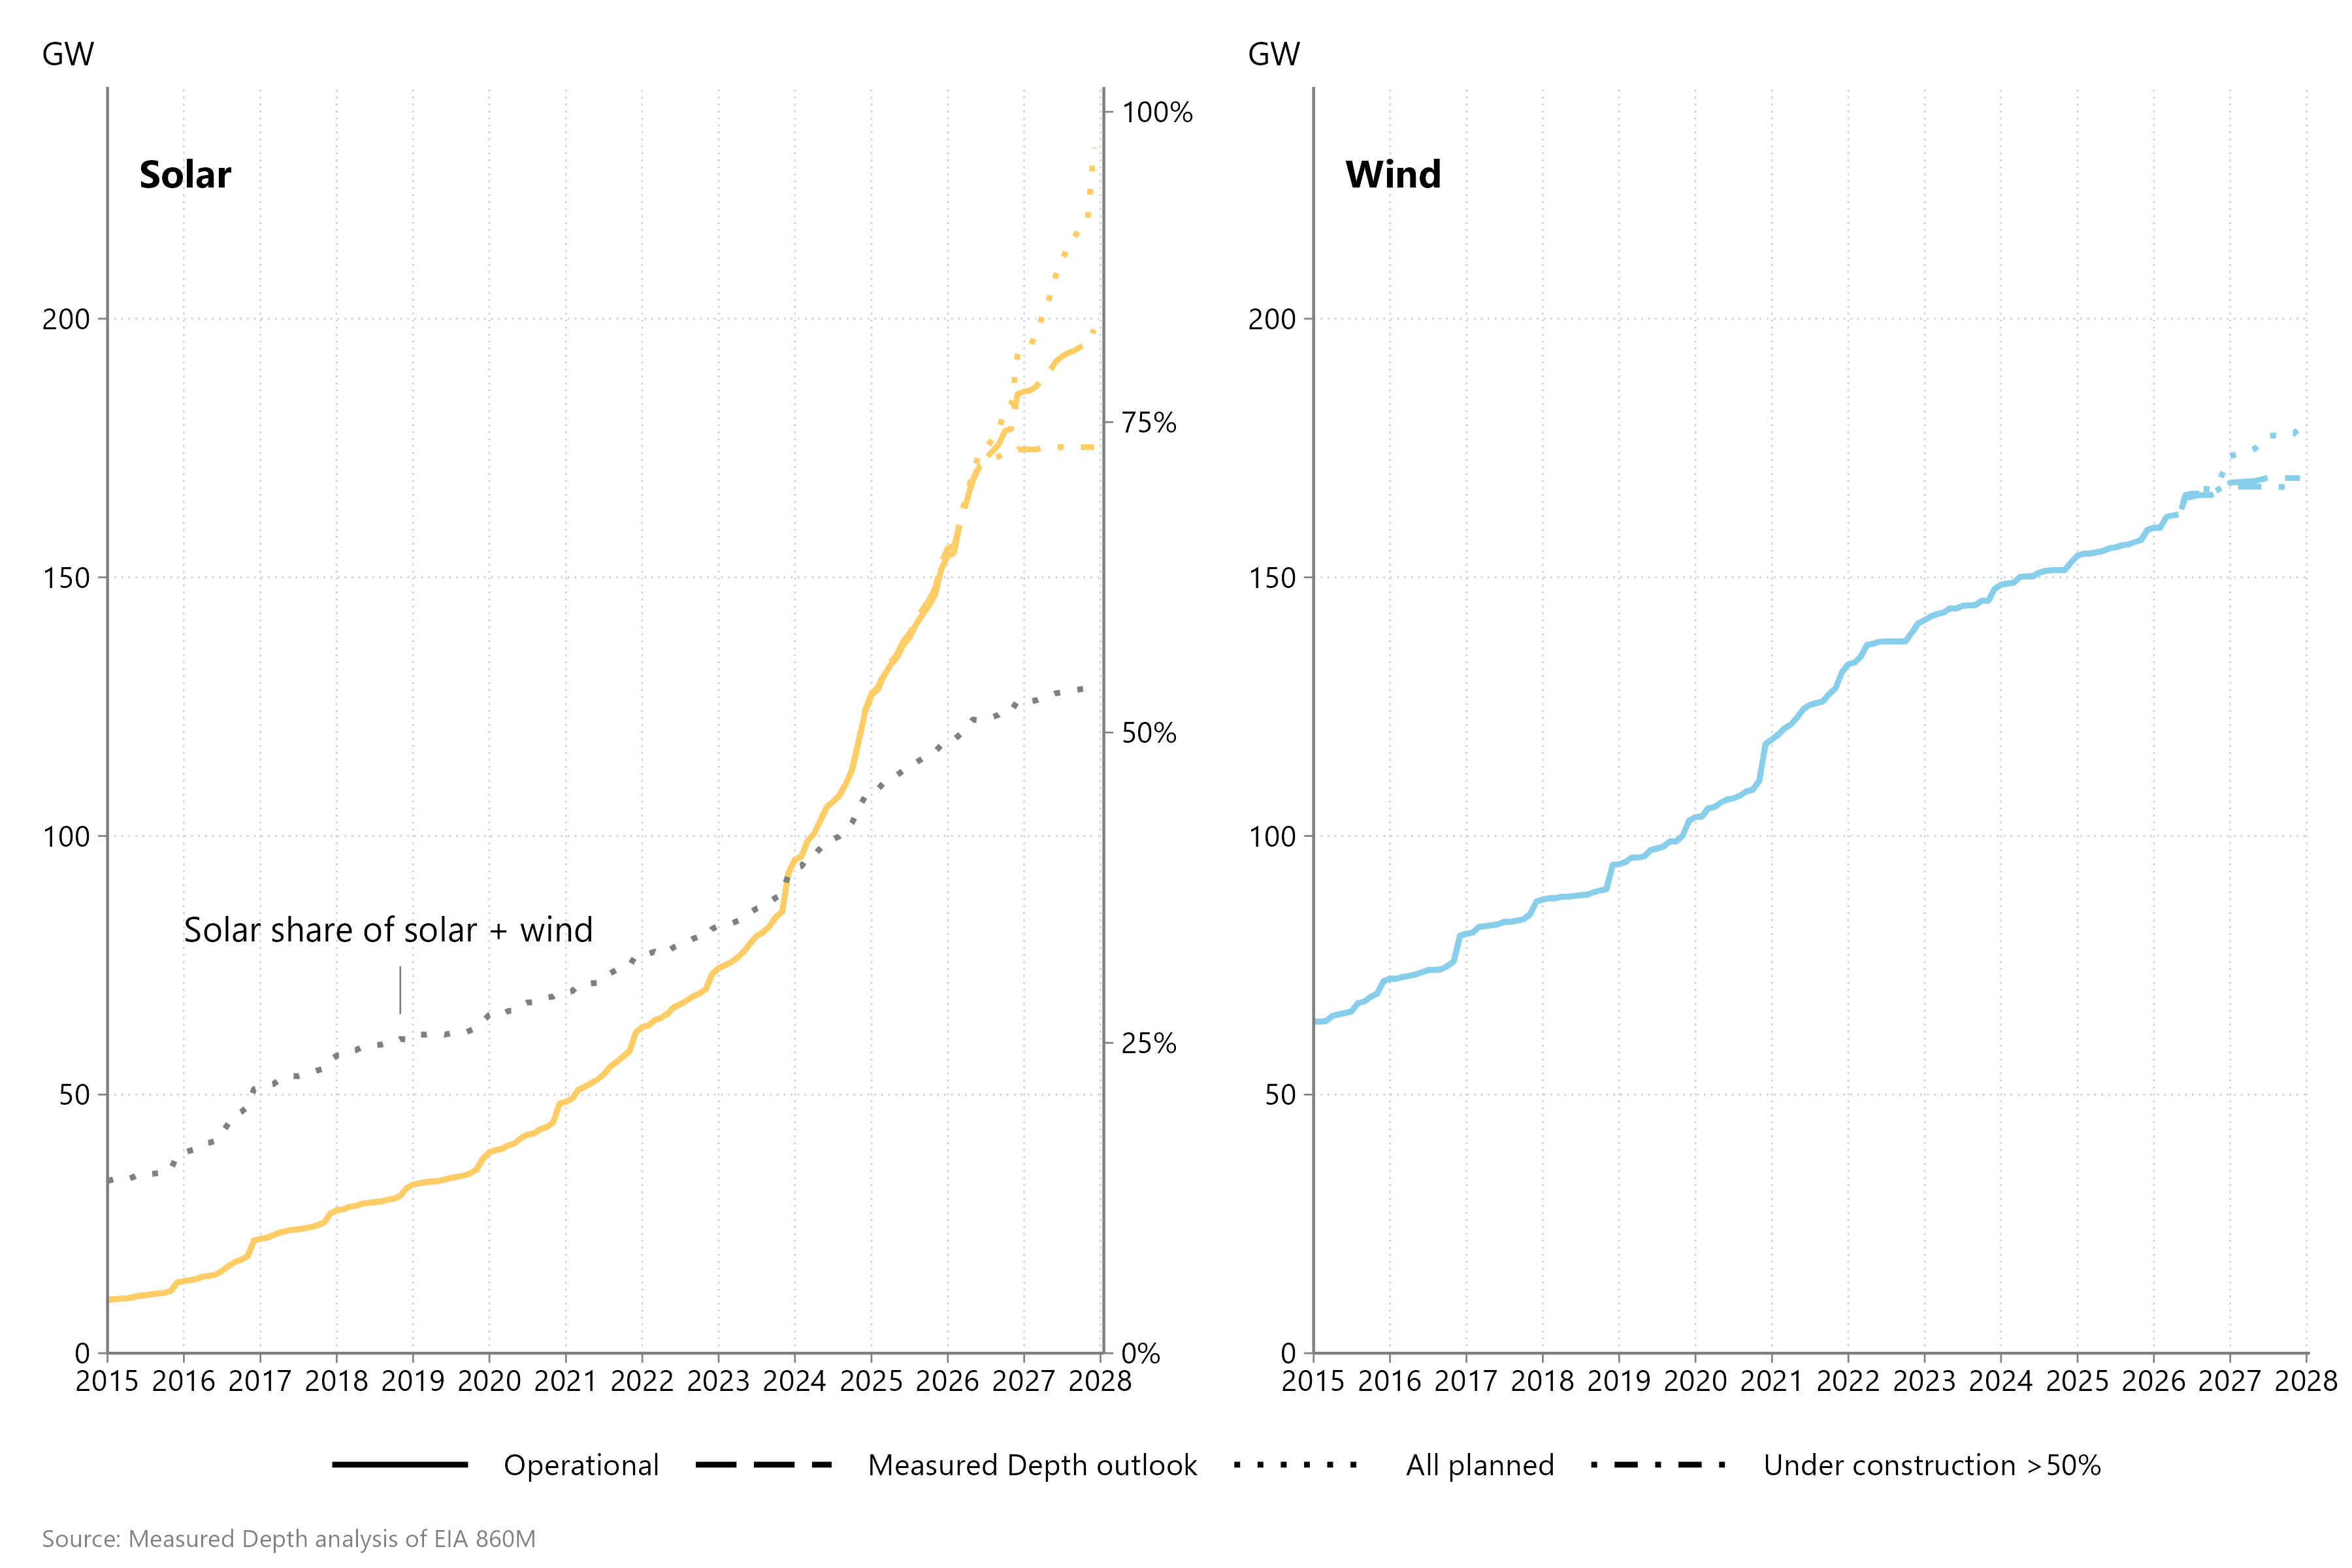
The EIA’s 860M electric generator report includes a project-by-project inventory of operational and planned capacity. Typically, this report understates currently operational capacity in recent months, particularly for solar, but the “planned” category includes speculative projects that will never materialize. By analyzing historical versions of this report, I risk-weight each of the EIA’s development lifecycle categories and further discount less-advanced wind projects based on sector-specific headwinds.
Based on the current development pipeline and this risking approach, solar would account for ~53% of combined wind and solar capacity by year-end, up from ~33% when Congress passed the IRA in August 2022.
Figure 1 | Solar and wind capacity outlook
Seasonality of wind and solar generation
If solar and wind utilization rates were consistent day-to-day or at least month-to-month, their impact on gas burn would be straightforward to disaggregate. However, two factors — shown in Figure 2 — complicate this analysis:
Load shapes — especially for solar — are highly seasonal
Day-to-day volatility — especially for wind — means generation does not reliably follow these seasonal shapes
Keep reading with a 7-day free trial
Subscribe to Measured Depth to keep reading this post and get 7 days of free access to the full post archives.