
Pipe scrapes can't tell you how much Permian gas froze off
Three reasons scrape-based production models break down during market disruptions

During market disruptions like winter storm Fern, Permian pipeline scrapes provide more distraction than insight. No amount of model-building or analytical horsepower can overcome the underlying problem: not enough real-time data.
A former colleague texted me last week, amid the disruptions from winter storm Fern, to ask what I thought about freeze-offs. He had heard estimates he thought were too high but was skeptical. My answer to him, and to all of you here now, is that we really don’t know, and we won’t have any idea until we see the storage number for the week ending January 29.
What do we actually know
Let’s start with what we actually can observe in real-time.
Typical Permian gas flows
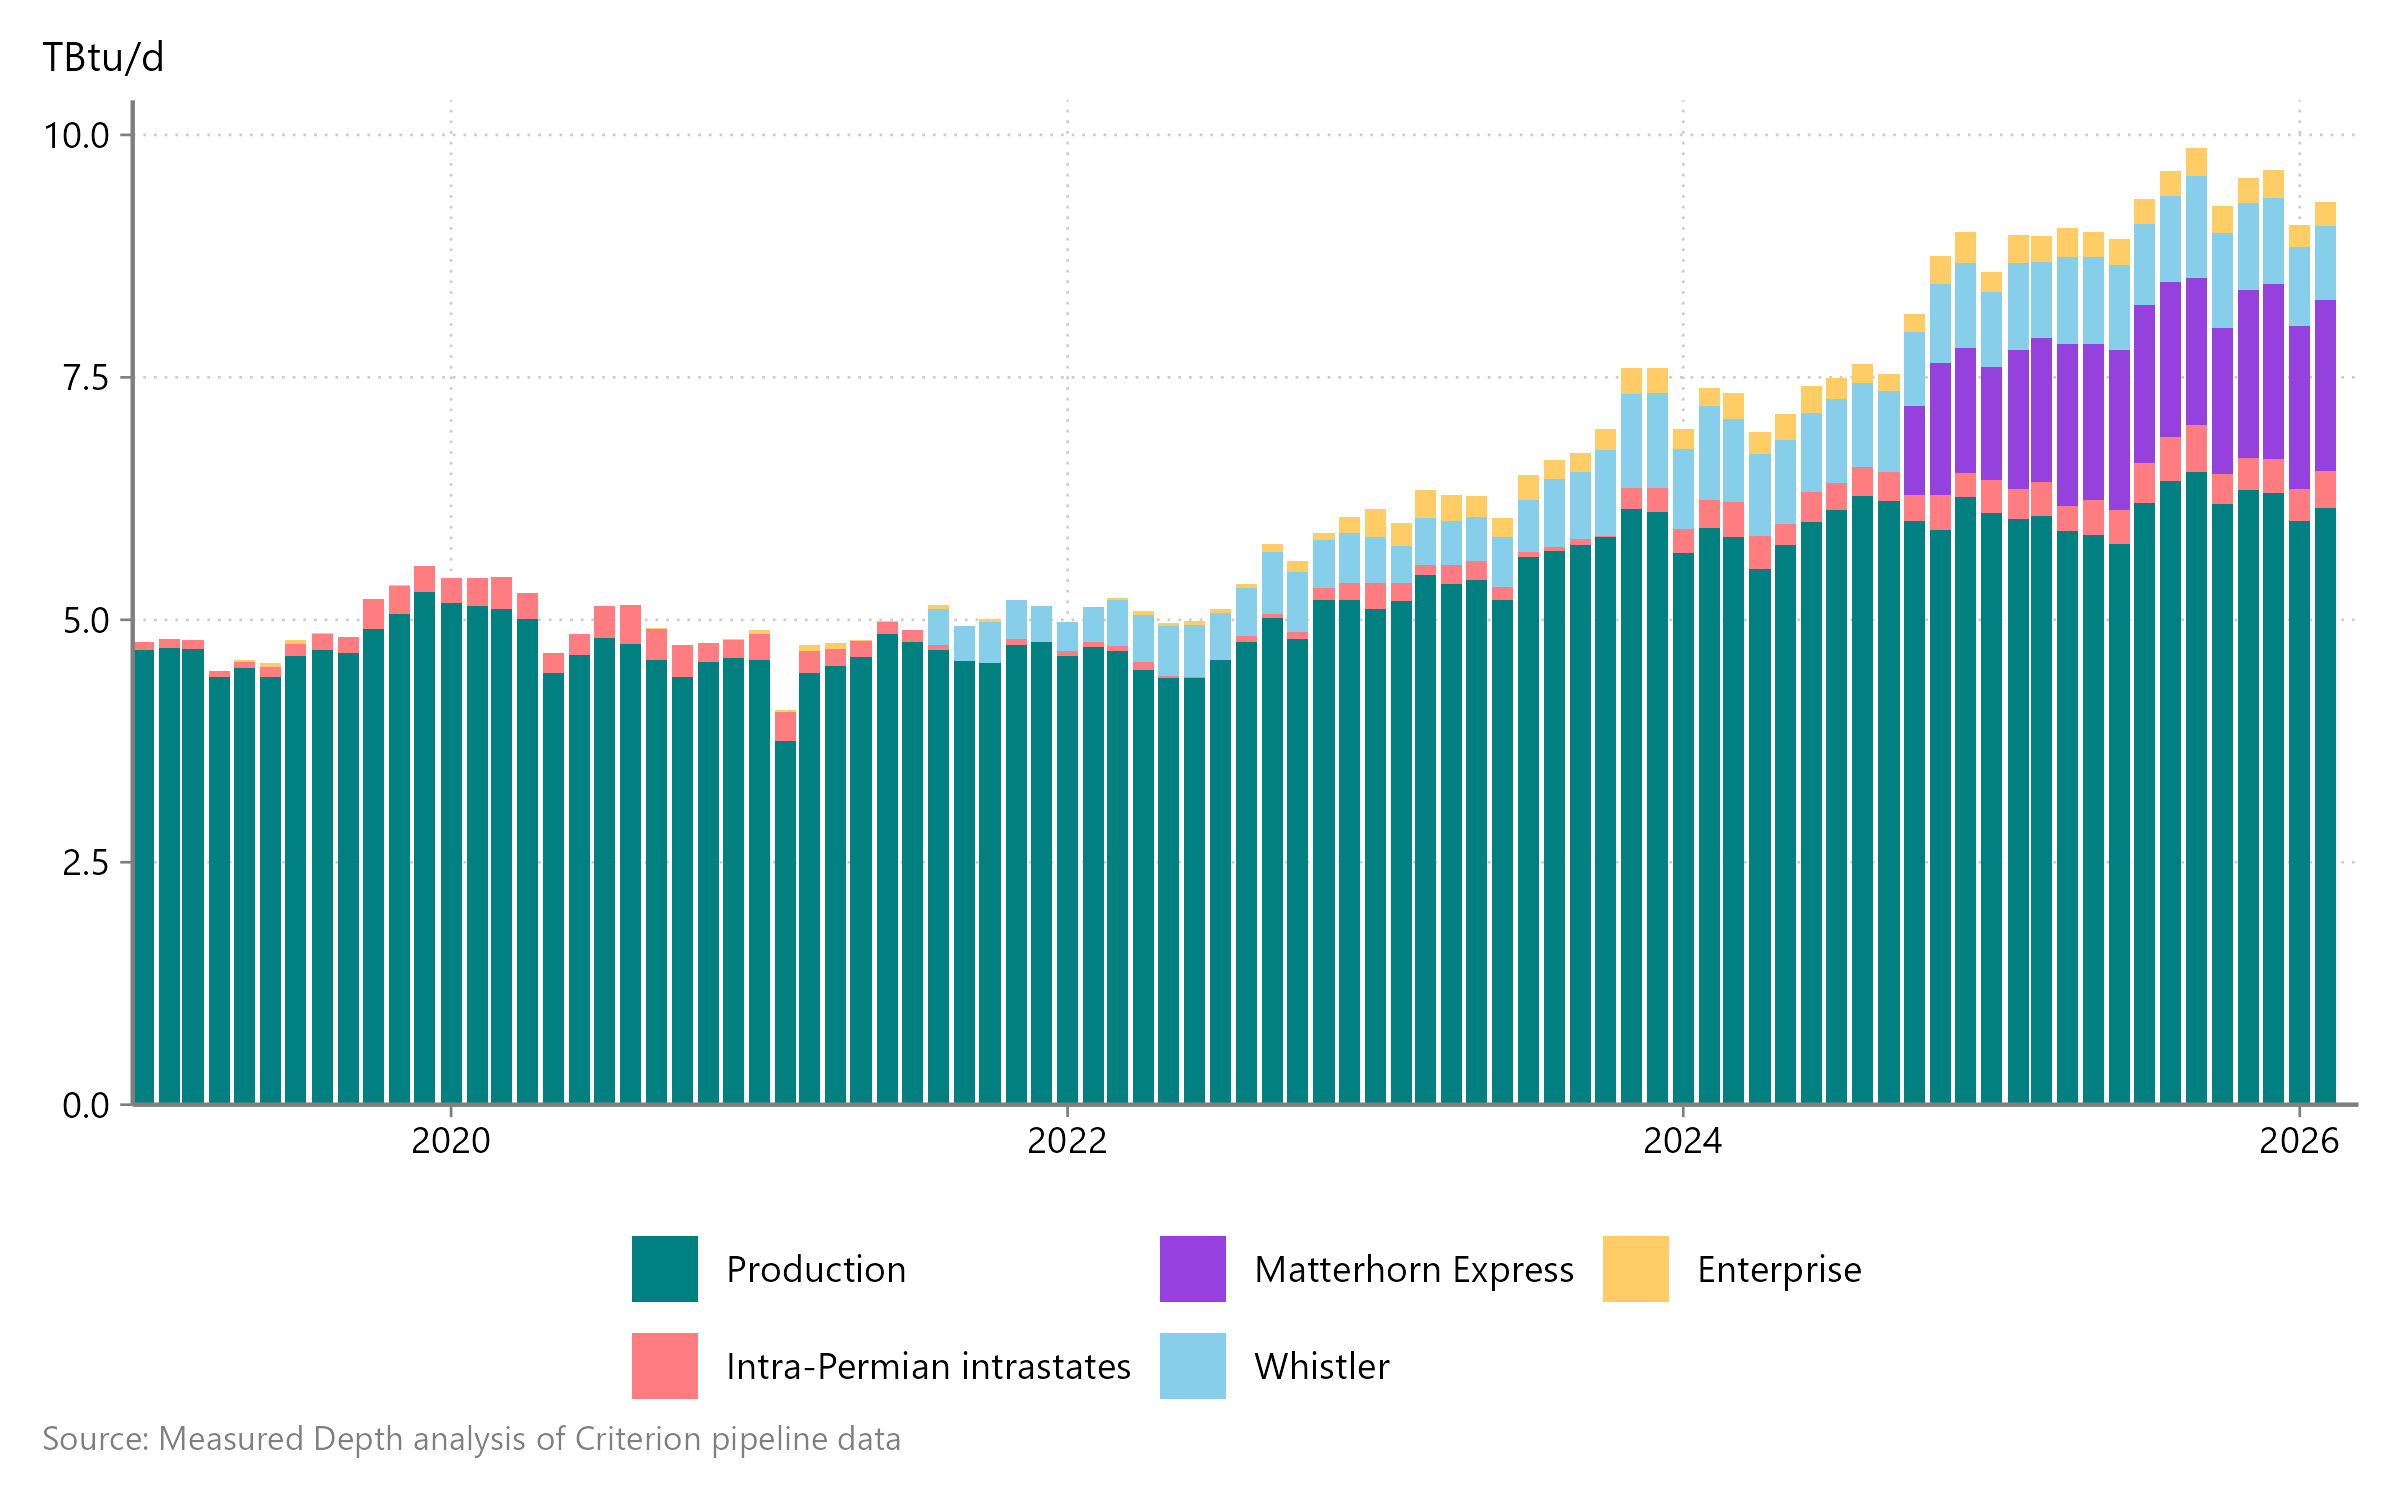
El Paso, TransWestern, NNG, and NGPL typically move1 ~6.5 TBtu/d, from a combination of direct connections to gathering systems and processing plants (shown in teal) and receipts from intrastate pipelines within the Permian (in pink). Since the final Matterhorn Express compressor station came online, it (in purple) and Whistler (in light blue) usually move ~2.5 TBtu/d to south Texas. Interstate receipts from Enterprise typically total an additional ~0.3 TBtu/d.
Figure 1 | Observable Permian scheduled gas volumes
Reduction in gas flows last week
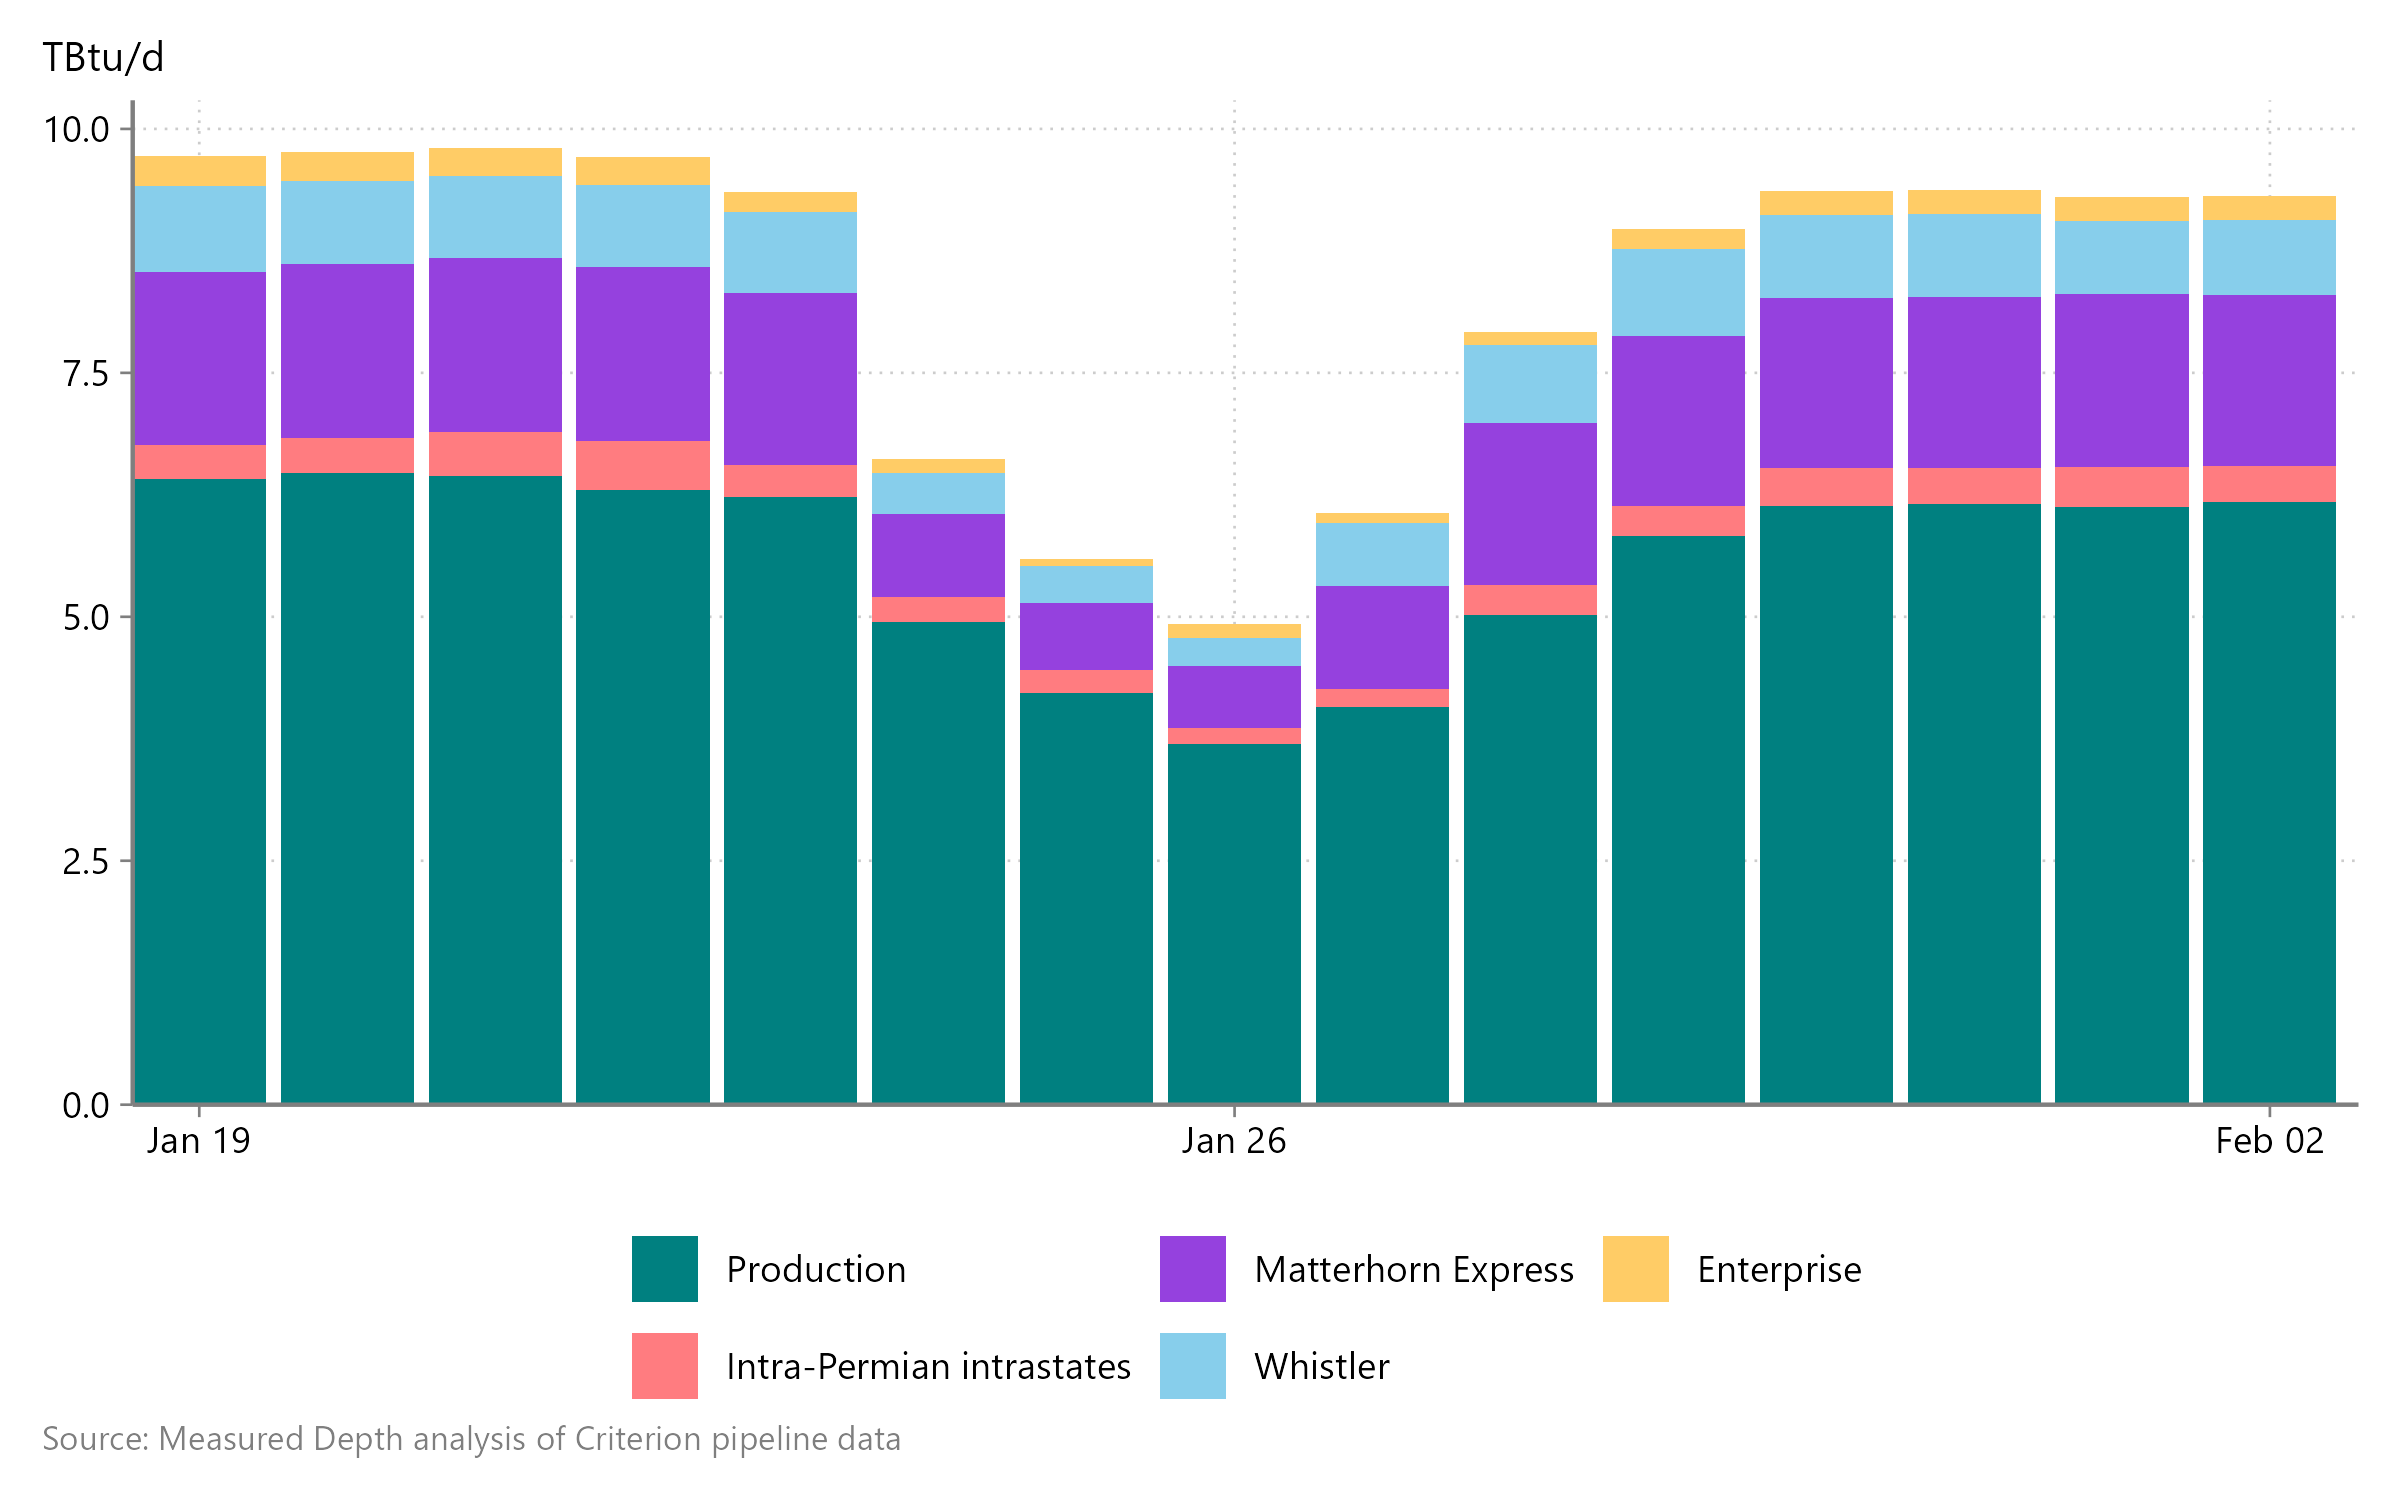
During winter storm Fern, these typical ~9.4 TBtu/d of flows fell to a low of ~4.9 TBtu/d. As of Monday, February 2, ~22 TBtu of production had been lost in aggregate. I show these flows in Ttu/d rather than converting to MMcfd because, as I'll discuss below, the conversion factor itself is uncertain.
Figure 2 | Recent observable Permian scheduled gas volumes
Historical Permian wellhead production
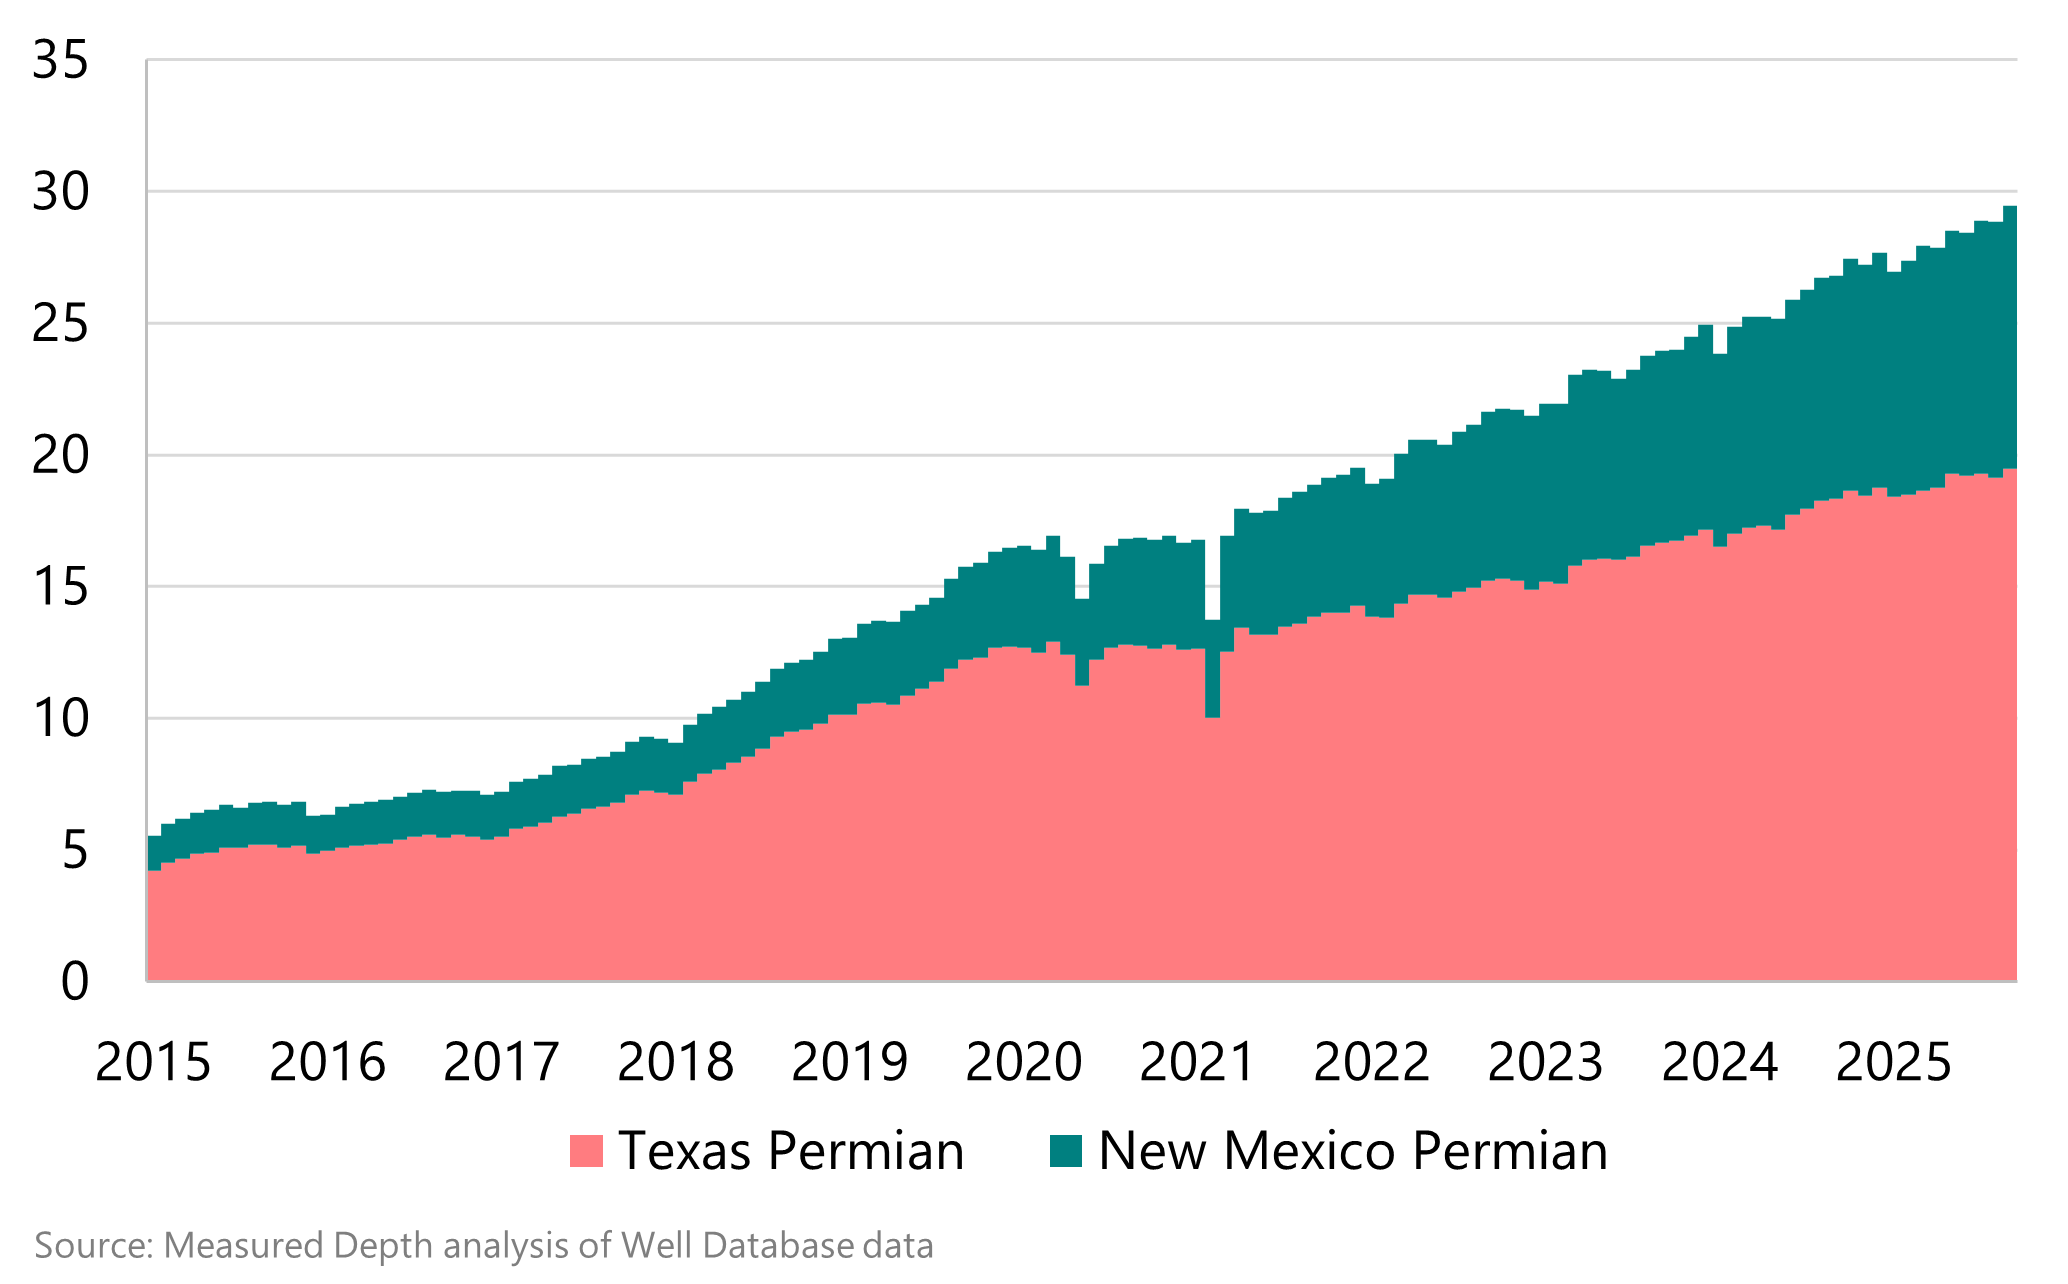
While the EIA only reports state-level production, operators must report lease- and/or well-level production to state regulatory agencies, for tax purposes. Aggregating this well-level data, then, gives insight into Permian-specific production.
Figure 3 | Reported wellhead Permian gas production
What we don’t know
However, these two data sets are not directly comparable for three reasons: volume versus energy, state reporting lags, and intrastate flows.
How much ethane was extracted
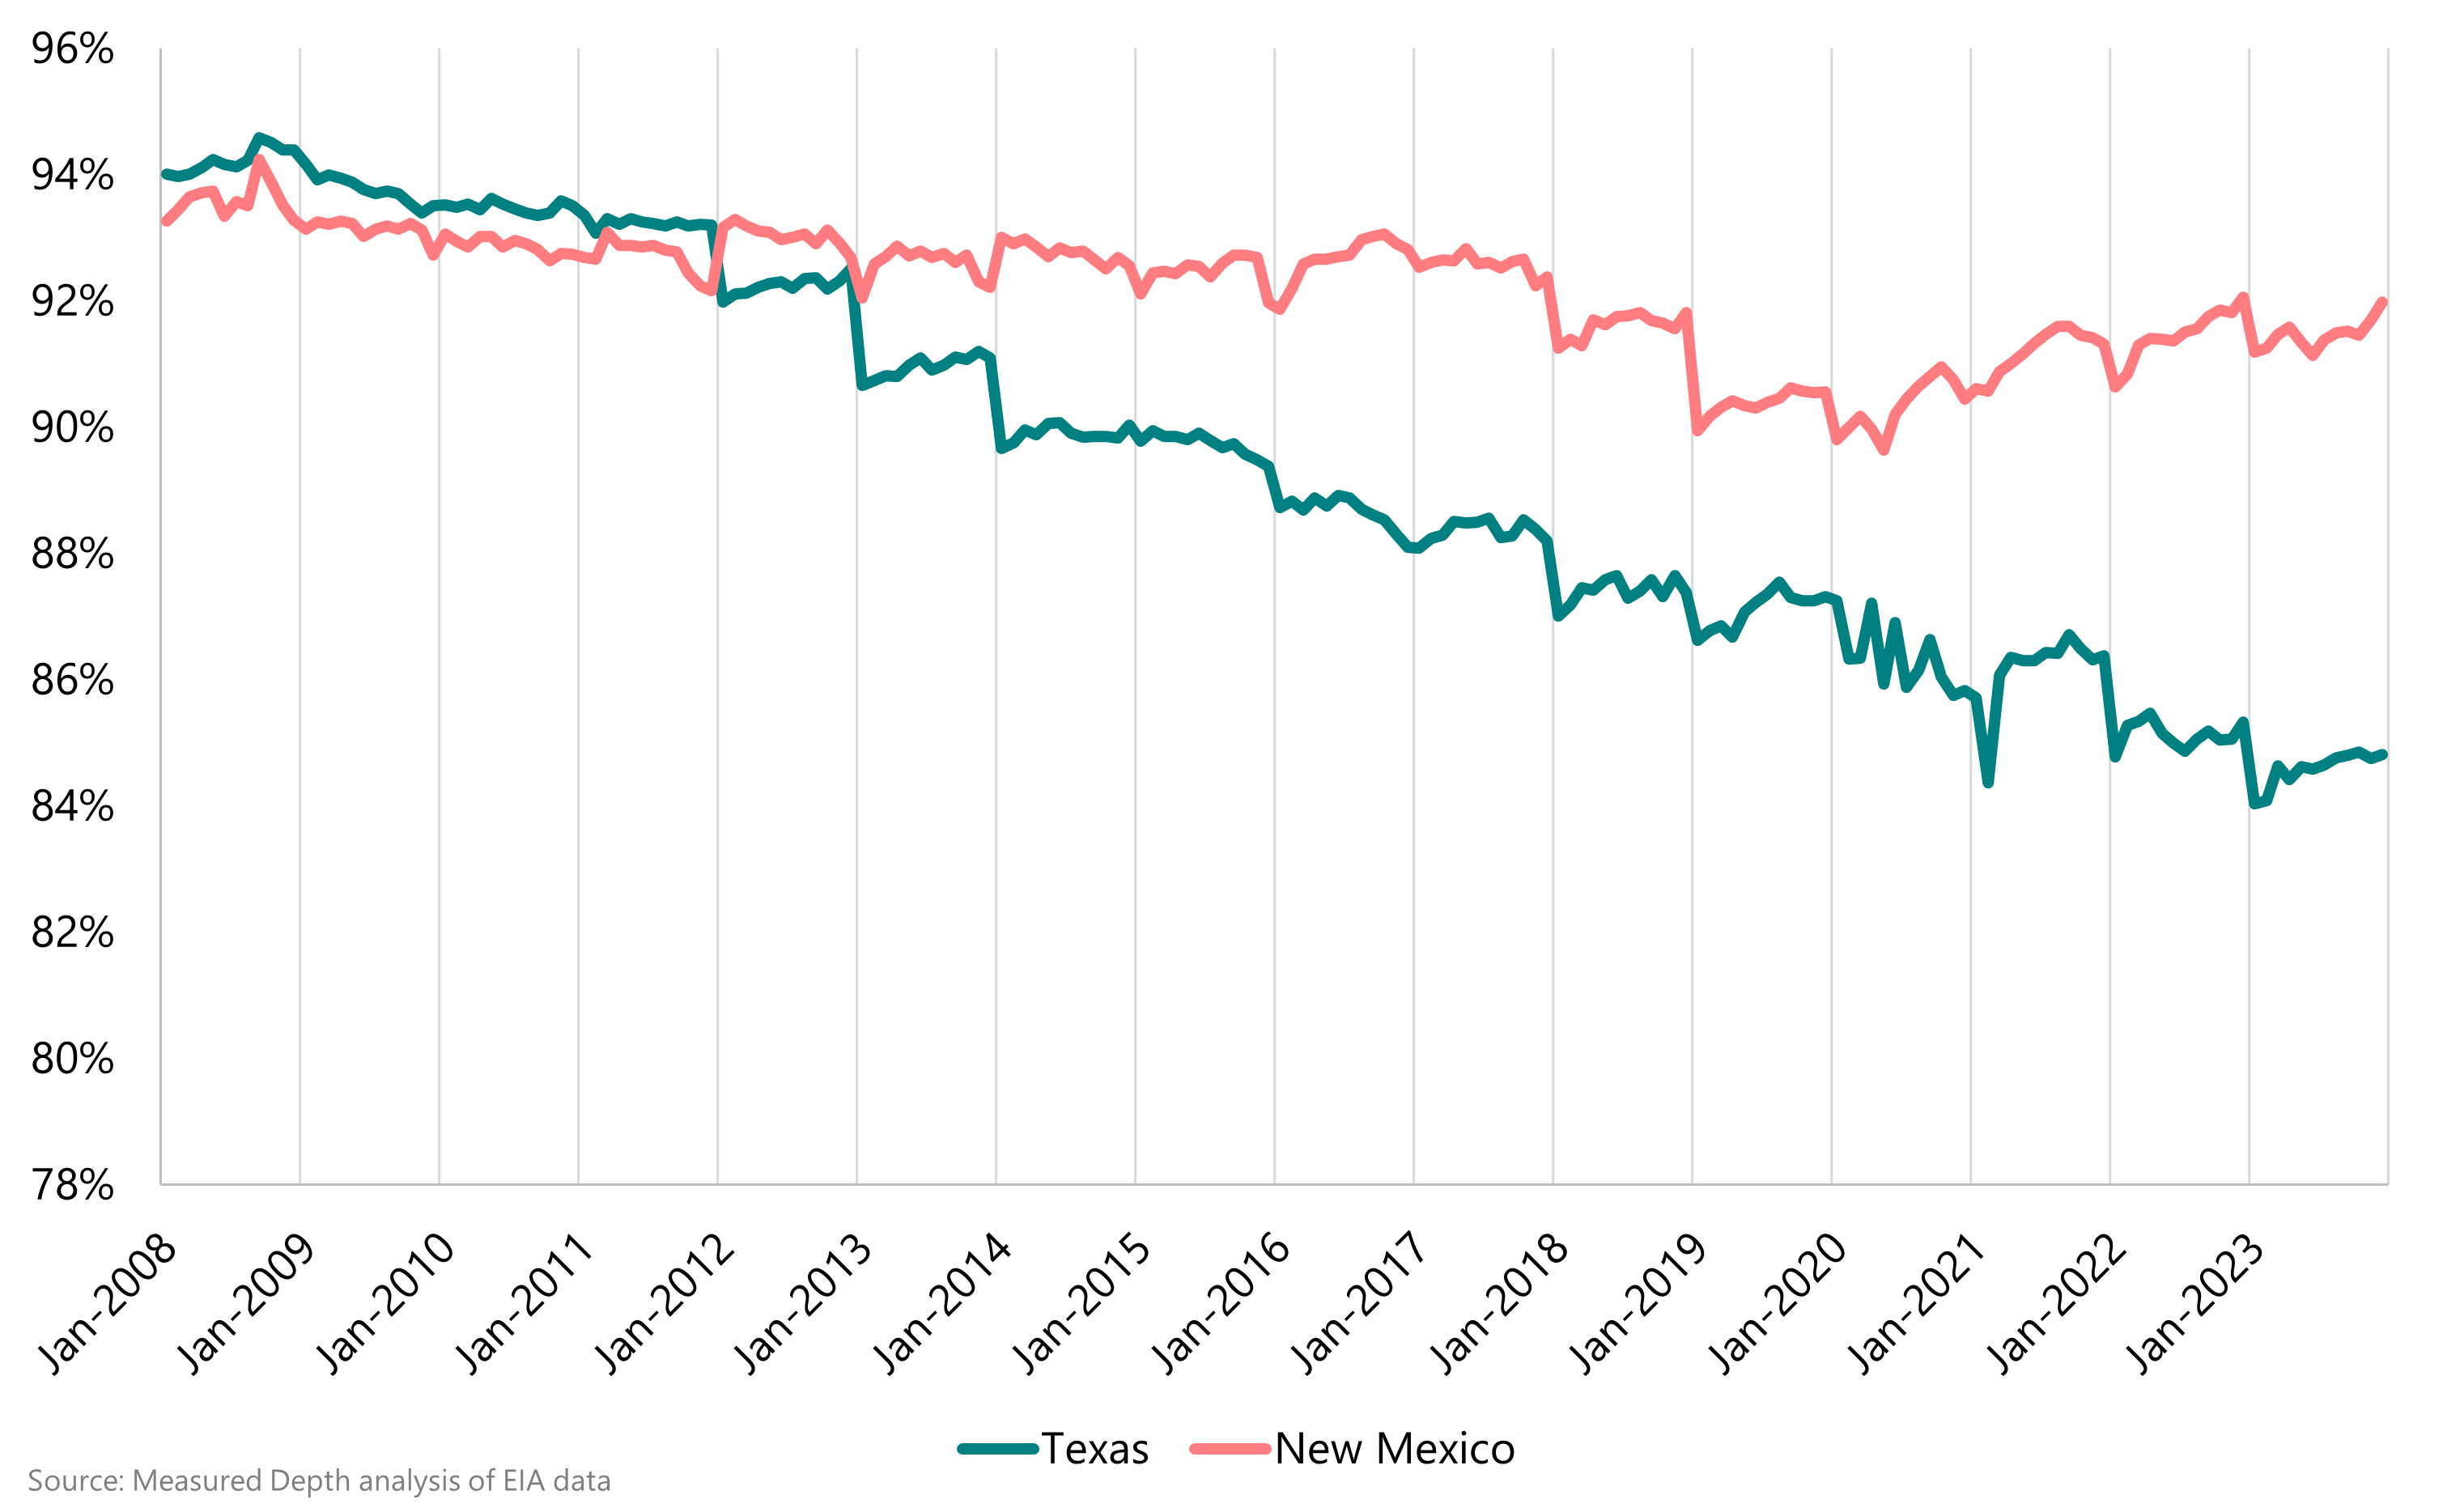
The first challenge in grossing up scrapes to total Permian dry gas production is that the latter is never actually reported. Analysts typically model it using a fixed (or slowly moving) dry-to-wellhead gas ratio, but in reality, the extent of ethane extraction varies with market conditions. In both Texas and New Mexico,2 the EIA’s estimates of dry-to-marketed gas ratios have been trending down over time, but the frequent step-changes between the end of one year and the beginning of the next point to uncertainty even in EIA’s state-level dry gas production estimates.
Figure 4 | Texas and New Mexico dry gas share of marketed gas production
On January 26, gas quality at a range of Permian interstate locations ran about 2% hotter than earlier in the month, as operators extracted less ethane in response to much higher gas prices. For a basin producing ~30 Bcfd at the wellhead, this ethane rejection could offset more than 1 Bcfd of freeze-offs.
How complete state-reported production data is
I’ve built many a well-level production model, and while 95% reporting is more than sufficient to construct an accurate type curve for a given operator, county, or play, it’s nowhere near sufficient for real-time production estimation. In a ~30 Bcfd play, the difference between 94% reporting and 96% reporting is 500 MMcfd — and you have no way of knowing which one you’re looking at. In both Texas and New Mexico, some well- or lease-level reporting trickles in over the course of a year or more after first production.
Figure 5 | EIA and state-reported New Mexico gas production
How observed routes behaved relative to unobservable ones
Two increments of “missing” dry gas production — lease/plant fuel and local consumption — are small and predictable. But most of the gap between wellhead production and interstate nominations is gas that moves on intrastates, which is neither.
All of the post-2018 Permian intrastate pipelines — Gulf Coast Express, Permian Highway, Whistler, and Matterhorn Express — move gas to south Texas. We can reasonably assume that these pipelines’ 9.6 Bcfd of capacity is fully utilized in normal market conditions, given how weak Waha prices have been. The typical ~2.5 TBtu/d of Whistler and Matterhorn deliveries into south Texas therefore accounts for just ~25% of this capacity.
But the freeze-offs in west Texas (and elsewhere) last weekend changed the underlying economics of Permian gas flows. Waha prices traded over Houston Ship Channel, meaning that if anything, the reduction in Permian→south Texas flows on these new intrastates was modest. Given this price signal, it is possible that GCX and PHP shippers made even bigger changes, and that the actual observed deliveries on Matterhorn Express and Whistler constituted more than the typical share of flows — or even all the flows — along this route.
Implications for freeze-off estimates
Given these uncertainties, to estimate freeze-offs, we need to compare the two series we actually know: scheduled interstate pipeline volumes and wellhead gas production. Even putting these two series on the same chart requires an assumption about calorific value, which, in reality, varies over time depending on market conditions.
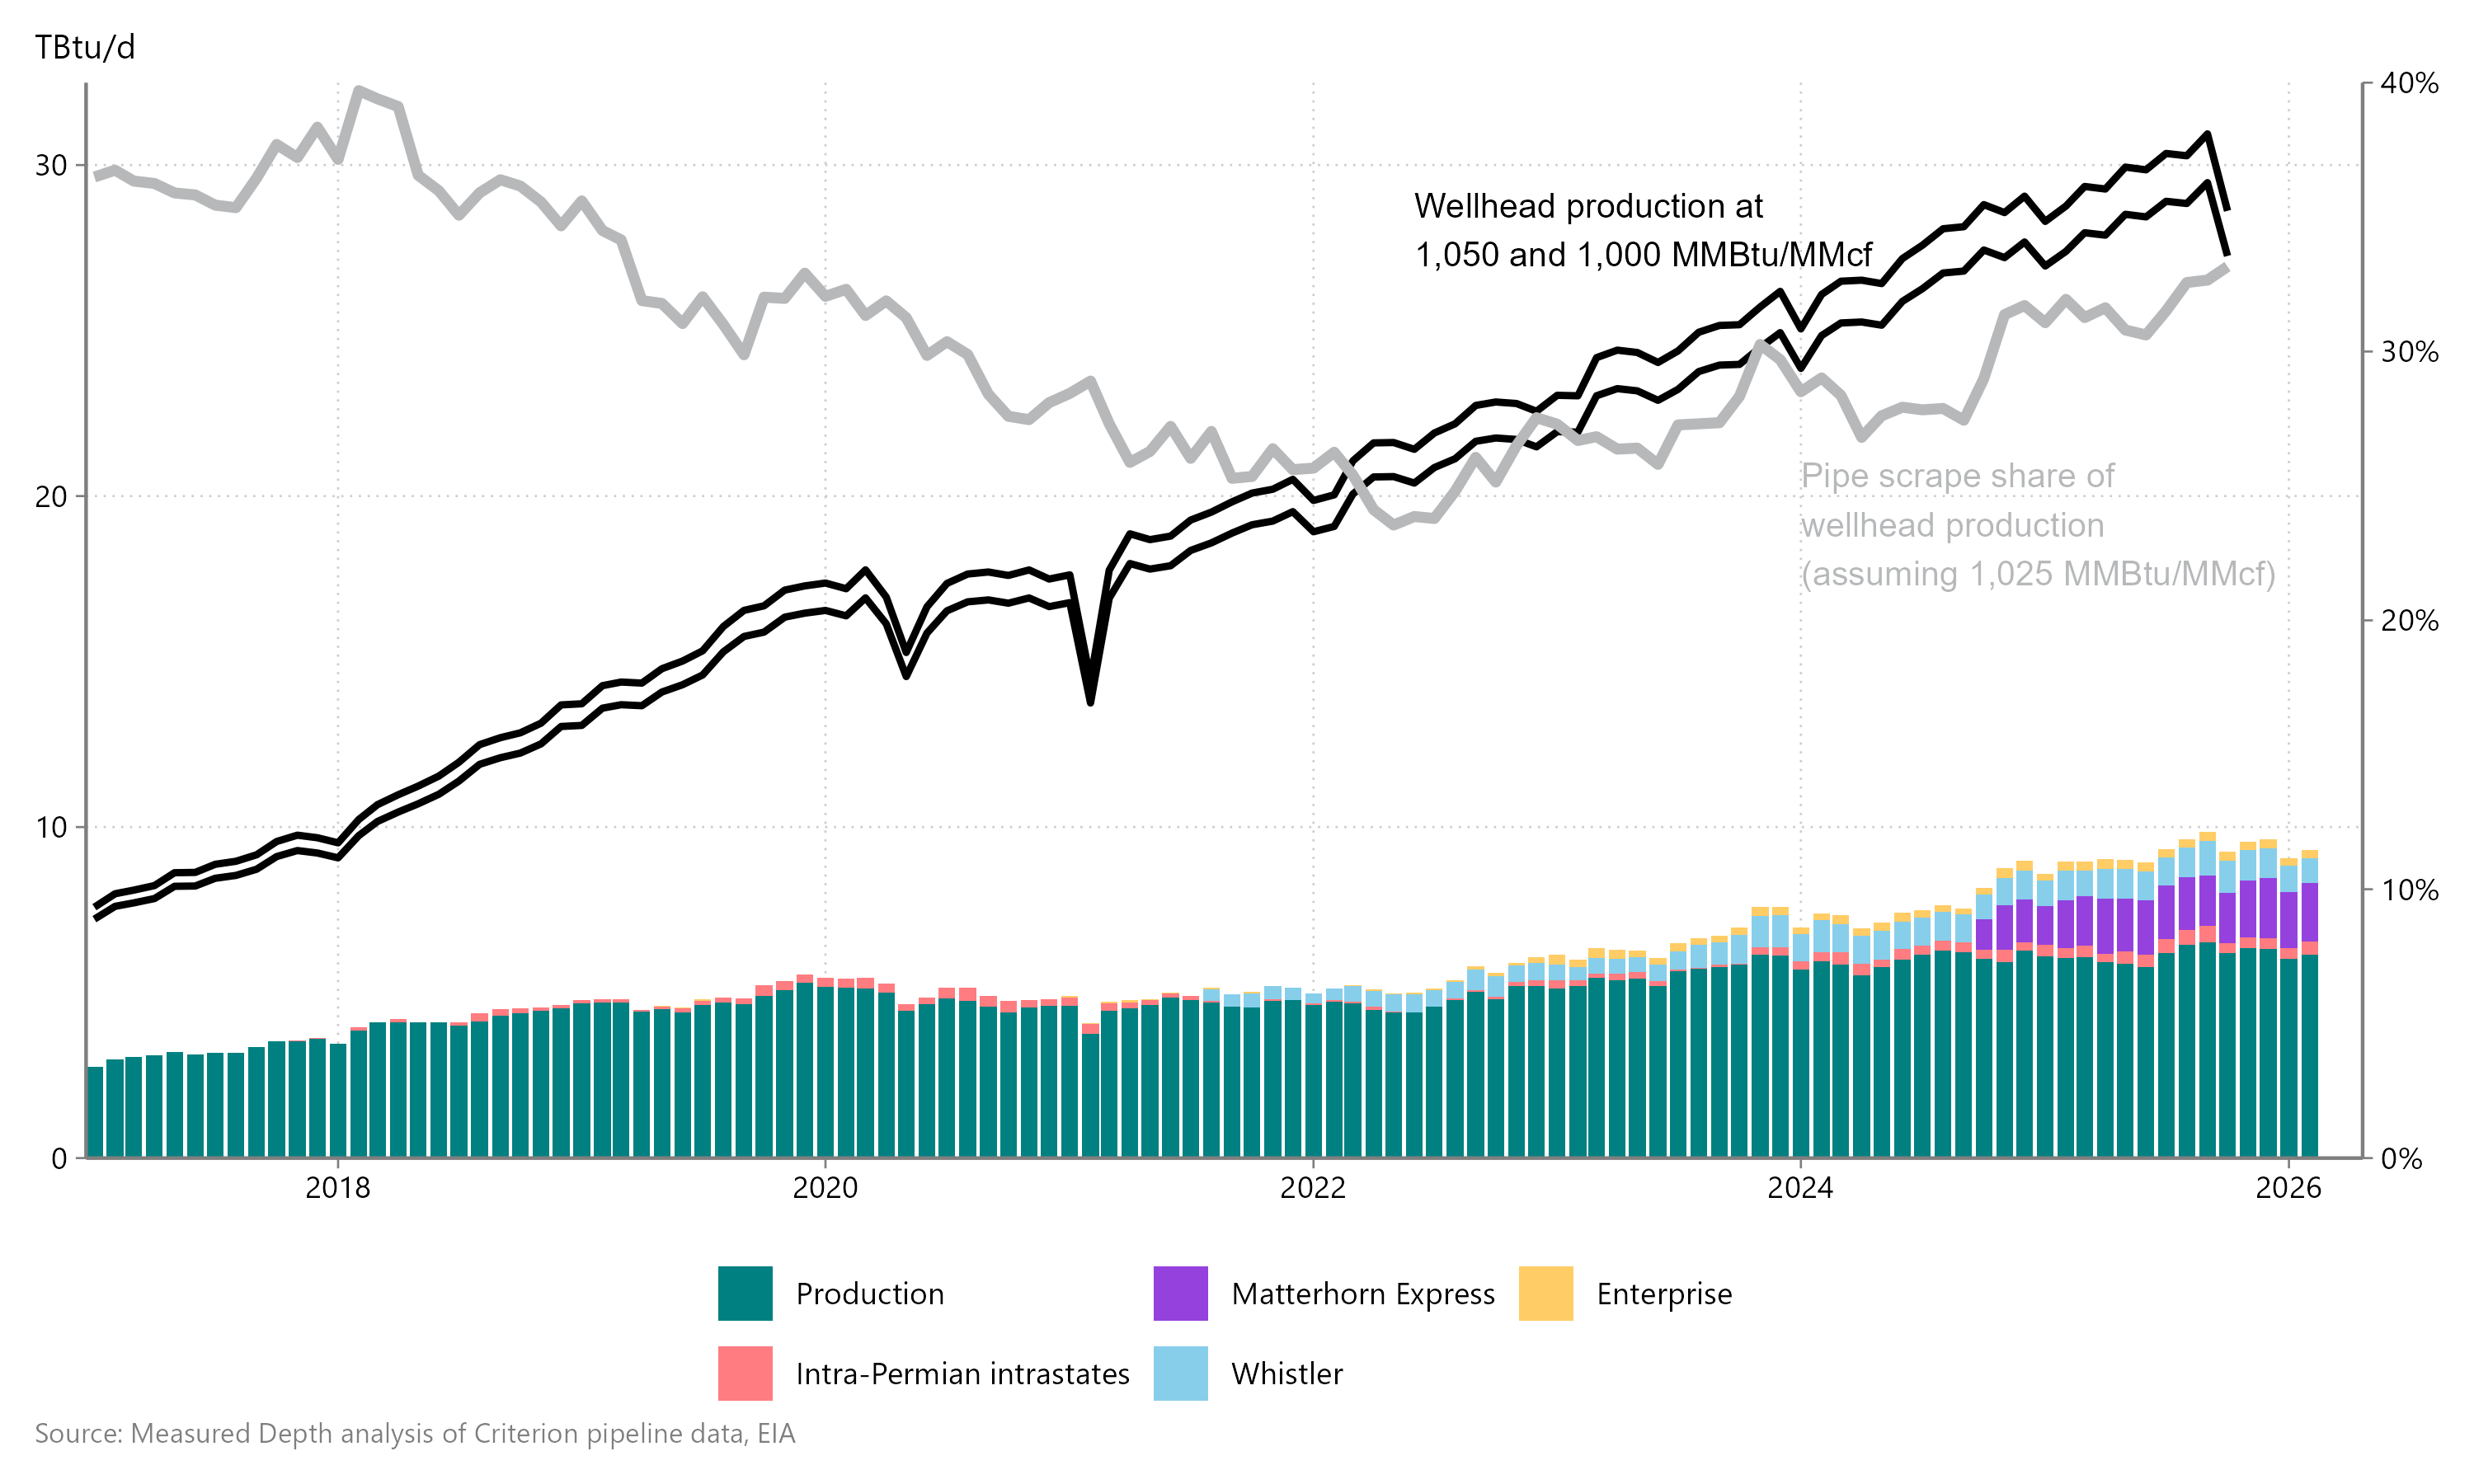
During winter storm Uri in February 2021, the observable share of Permian wellhead production increased by 1.7 percentage points relative to the surrounding six months, as shown in the gray line in Figure 6. Given that these disruptions lasted only 12 days and were severe for just five, the observable share of wellhead production likely rose 6-8 percentage points during the shut-ins. Conversely, freeze-offs in January 2024 were more evenly distributed, with the observable share of total wellhead production broadly consistent with the surrounding six months.
At the scale of today’s Permian production, whether this storm is more like Uri or like January 2024 cold weather could swing Permian freeze-off estimates by 3-4 Bcfd at peak, and 15-20 Bcf in aggregate. Uncertainty, due to state reporting lags and varying levels of ethane extraction, about what the baseline Permian dry gas production was before the storm widens the possible range by an additional 5-8 Bcf.
Figure 6 | Permian wellhead gas production and pipeline scrapes
In a basin like Appalachia, where more than 95% of gas flows on interstate pipelines, and where higher transportation costs mean ethane extraction doesn’t swing in and out of the money as frequently, pipeline scrapes provide a reliable real-time production estimate, even during market disruptions. In the Permian, though, the combination of slow production reporting, mostly intrastate flows, and significant month-to-month variation in ethane extraction means that scrape-based production models often provide more noise than signal.
If we really want to be technical, scheduled volumes are different than physical flows, but at least the pipelines in question here aren’t the ones with huge no-notice swings
In New Mexico, the ratio has fallen much more slowly, not because the wellhead share hasn’t also declined but because a significant share of New Mexico Permian production is processed in Texas, and the EIA’s estimates are driven by where the gas is processed.
So basically we're all just squinting at pipeline data pretending to know things until the storage numbers come out? That 22 TBtu drop sounds massive but who really knows with all those intrastate flows hidding in the background