

Gas demand capex rose sharply in 2025-26, fueling excitement that higher prices would come soon after. But this year, for the first time in the capital discipline era, Henry Hub prices weakened without a major external shock. This decline has prompted another wave of gas market bearishness:

But the bullish gas demand themes haven’t come true yet. For both LNG and gas-fired generation, rising capex translates into accelerating demand only after a multi-year lag. As I’ll show, gas demand growth should set an all-time record in 2028 and average about twice the current pace over 2028-31. This year’s solid-but-unspectacular demand growth hasn’t pushed prices upward, but the much faster 2028-31 pace will likely require sustained prices above $4/MMBtu.
LNG: 2025 saw record FIDs, but demand acceleration comes in 2028-31
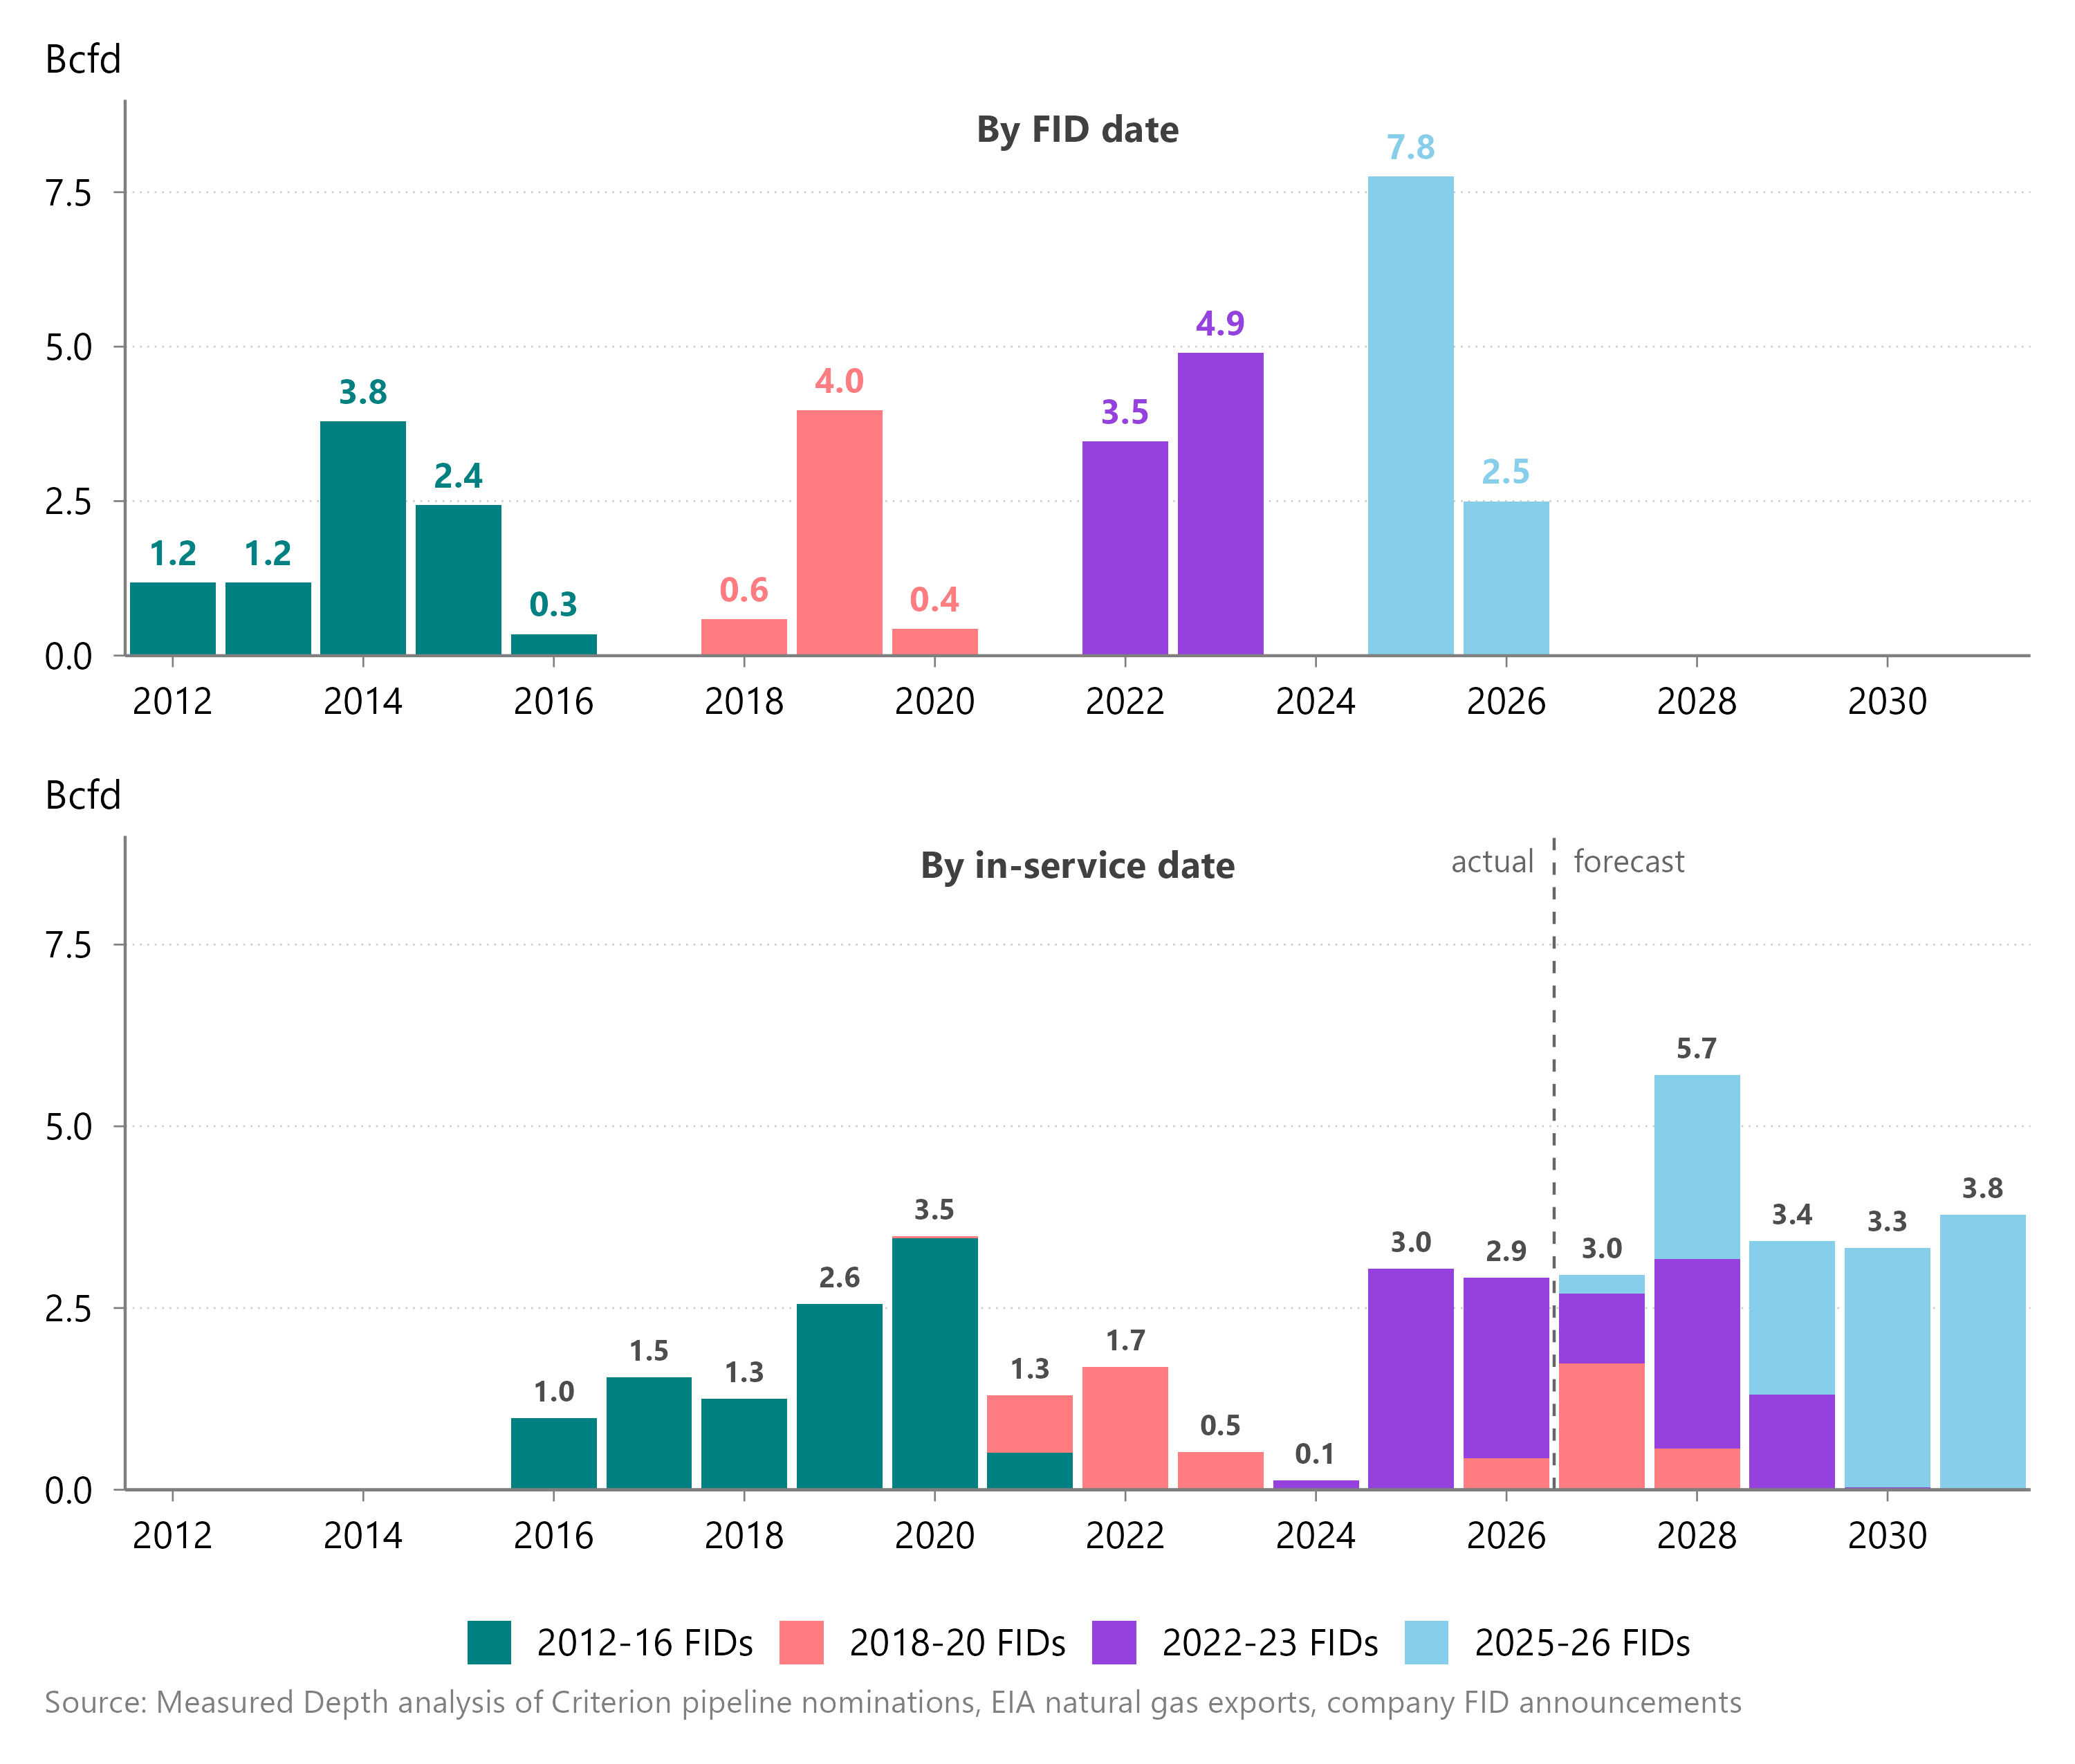
Almost 8 Bcfd of US liquefaction capacity took FID in 2025 alone, the highest figure on record, and more than total global FIDs in all but two years historically. Even if half of these FIDs would have landed in 2024 without former US President Joe Biden’s ill-advised pause on non-FTA export approvals, the US would still have seen a four-year streak of at least 3.5 Bcfd of liquefaction FIDs. Over the entire 2012-21 period, US LNG FIDs reached that level just twice.
The FIDs at the start of this window are already adding demand: US liquefaction capacity additions averaged ~3 Bcfd in 2025-26. But neither 2025 nor 2026 will match any year in 2028-31, and 2028 alone nearly equals the two combined.
Figure 1 | US1 LNG FIDs and demand growth
Power: Gas demand growth has softened in recent years but will accelerate in the medium term
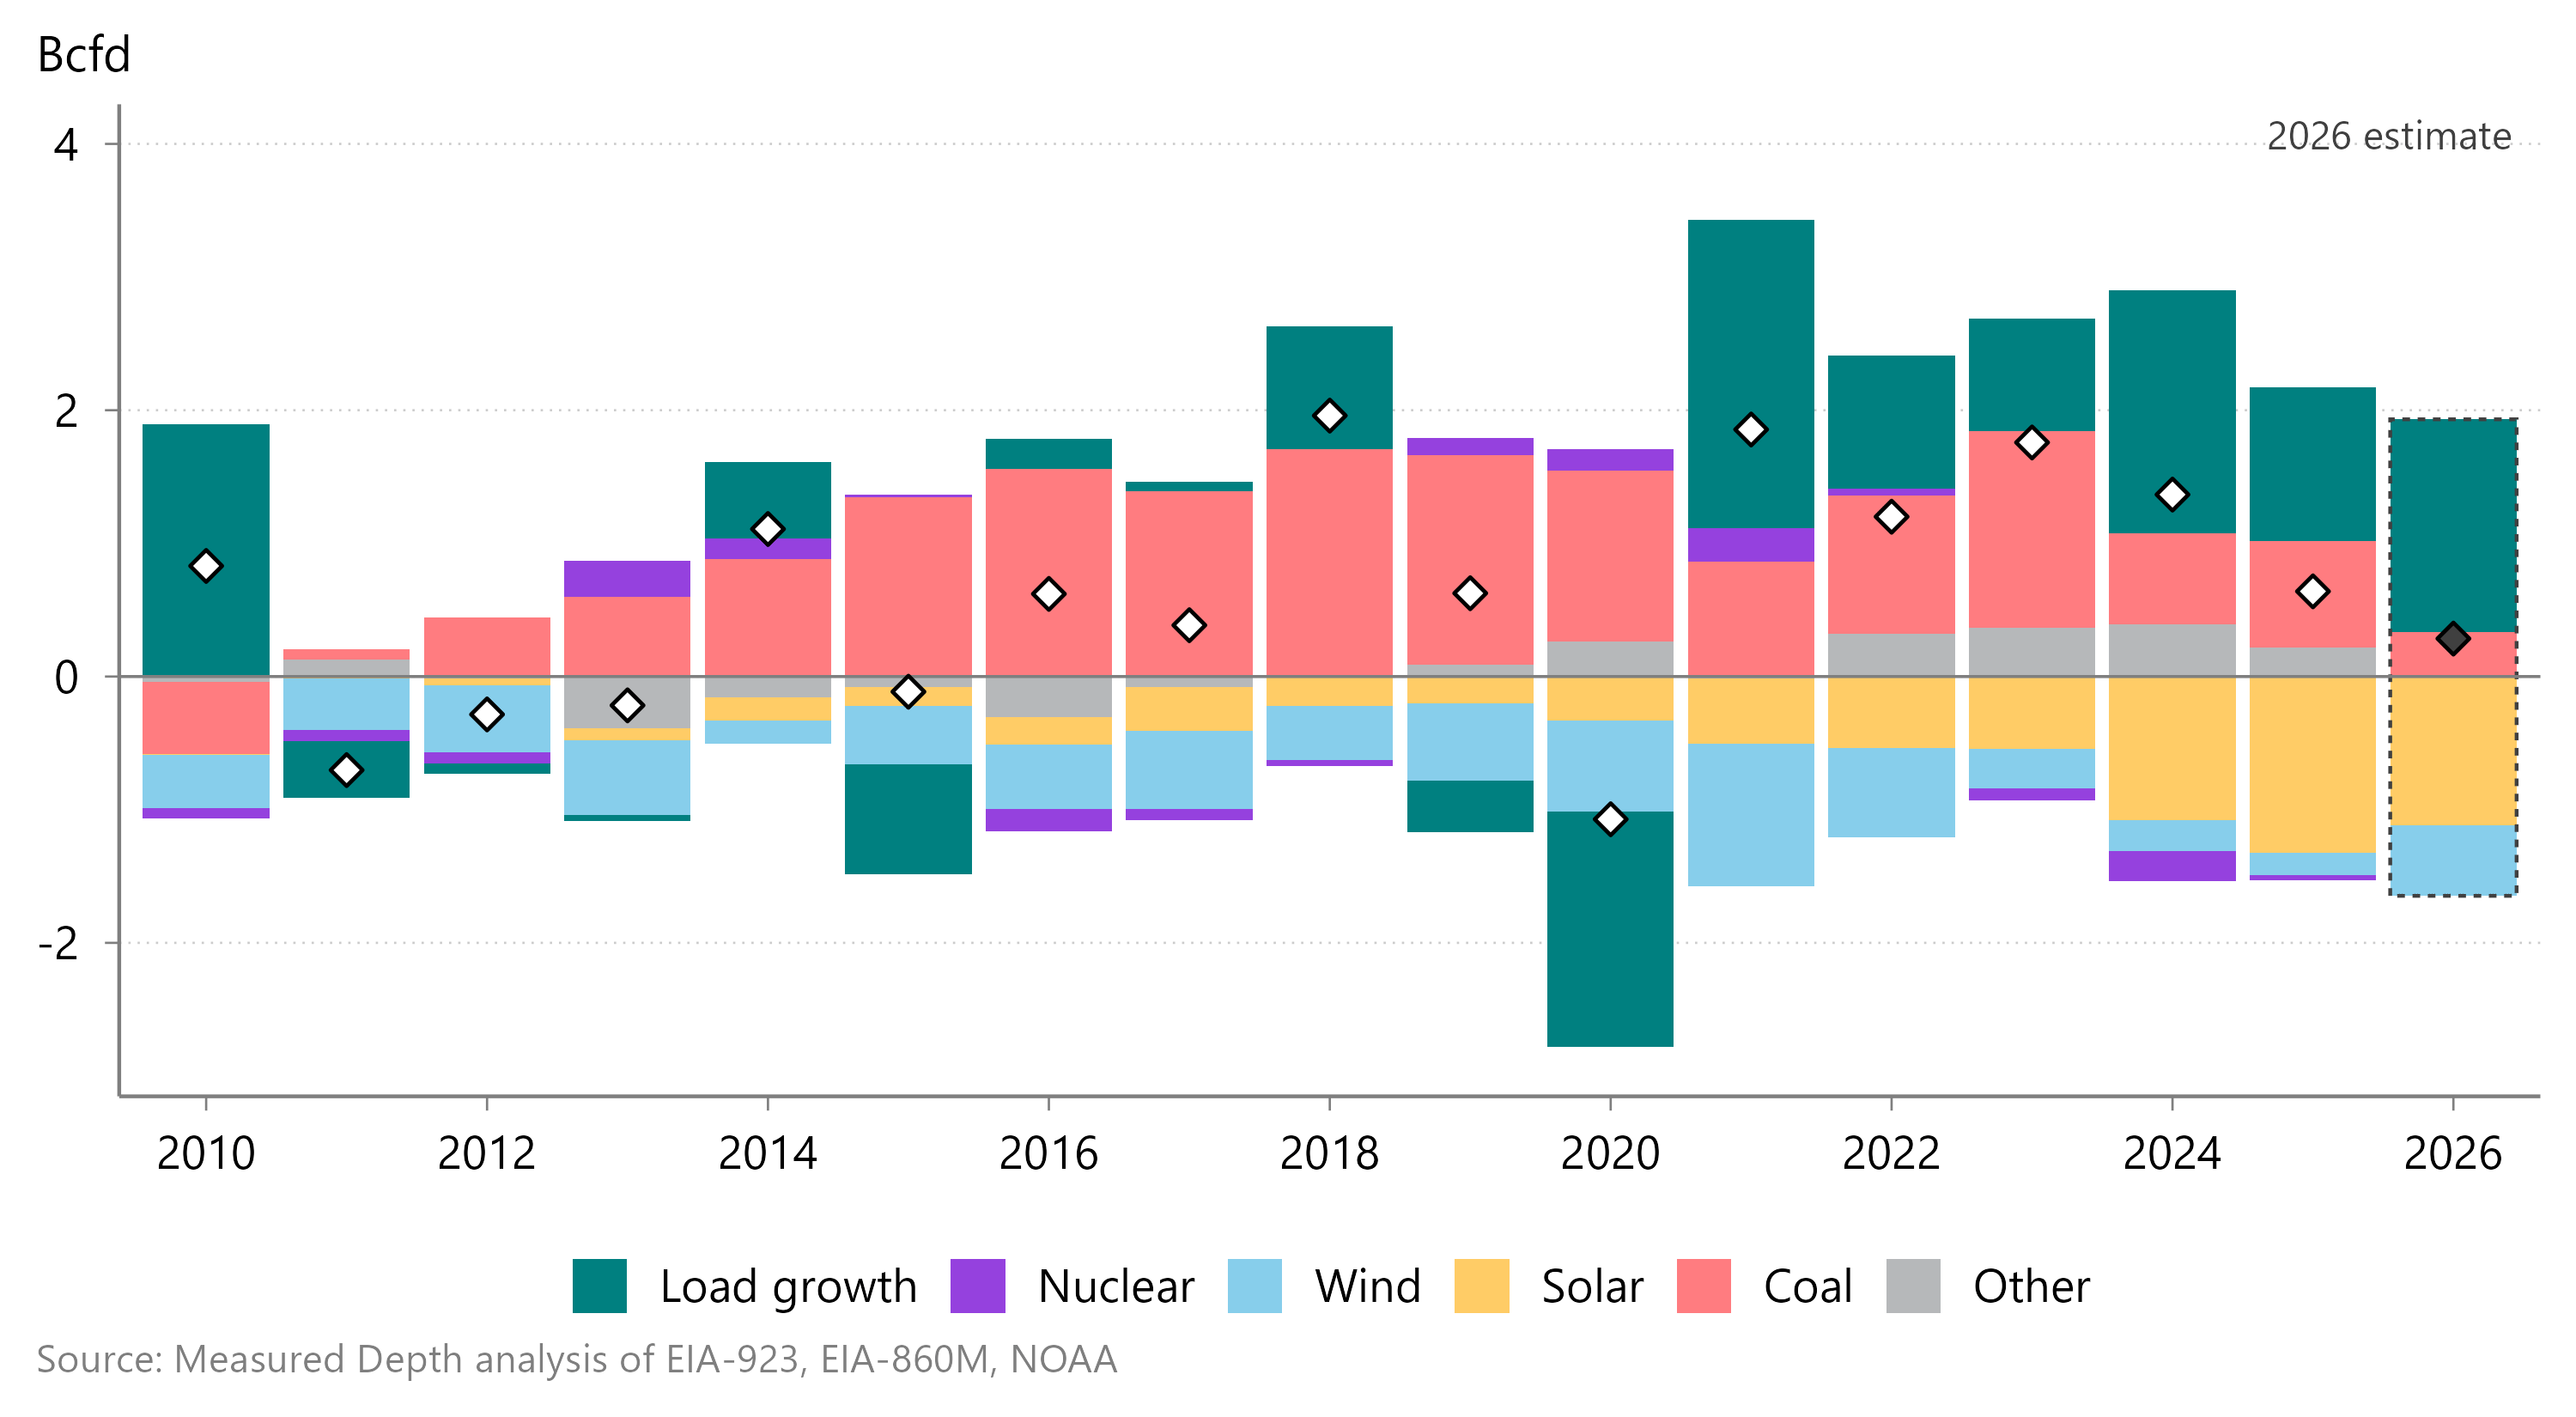
While US LNG demand will accelerate from today’s already-strong levels, gas-fired generation will accelerate from a much weaker base. Weather and year-to-year swings in gas prices obscure the underlying trend, so I estimate structural gas demand from load growth and capacity changes for competing fuels.
Load growth has accelerated sharply since 2023, adding ~1.5 Bcfd of gas demand annually. But solar generation climbed alongside it, and coal retirements have recently slowed. The net result: after growing ~1.2 Bcfd annually in 2020-24, structural gas demand growth averaged just ~200 MMcfd in 2025-26.
Figure 2 | Structural gas-fired generation growth by driver
That coal retirement trend is unlikely to reverse soon. Over the last year, the Department of Energy issued 202(c) orders keeping ~3.5 GW of coal capacity slated for retirement online, and utilities have delayed or canceled another ~28 GW on their own. Rising CC utilization rates leave little spare capacity in many markets,2 so utilities need to build new gas-fired capacity before they can retire more coal.
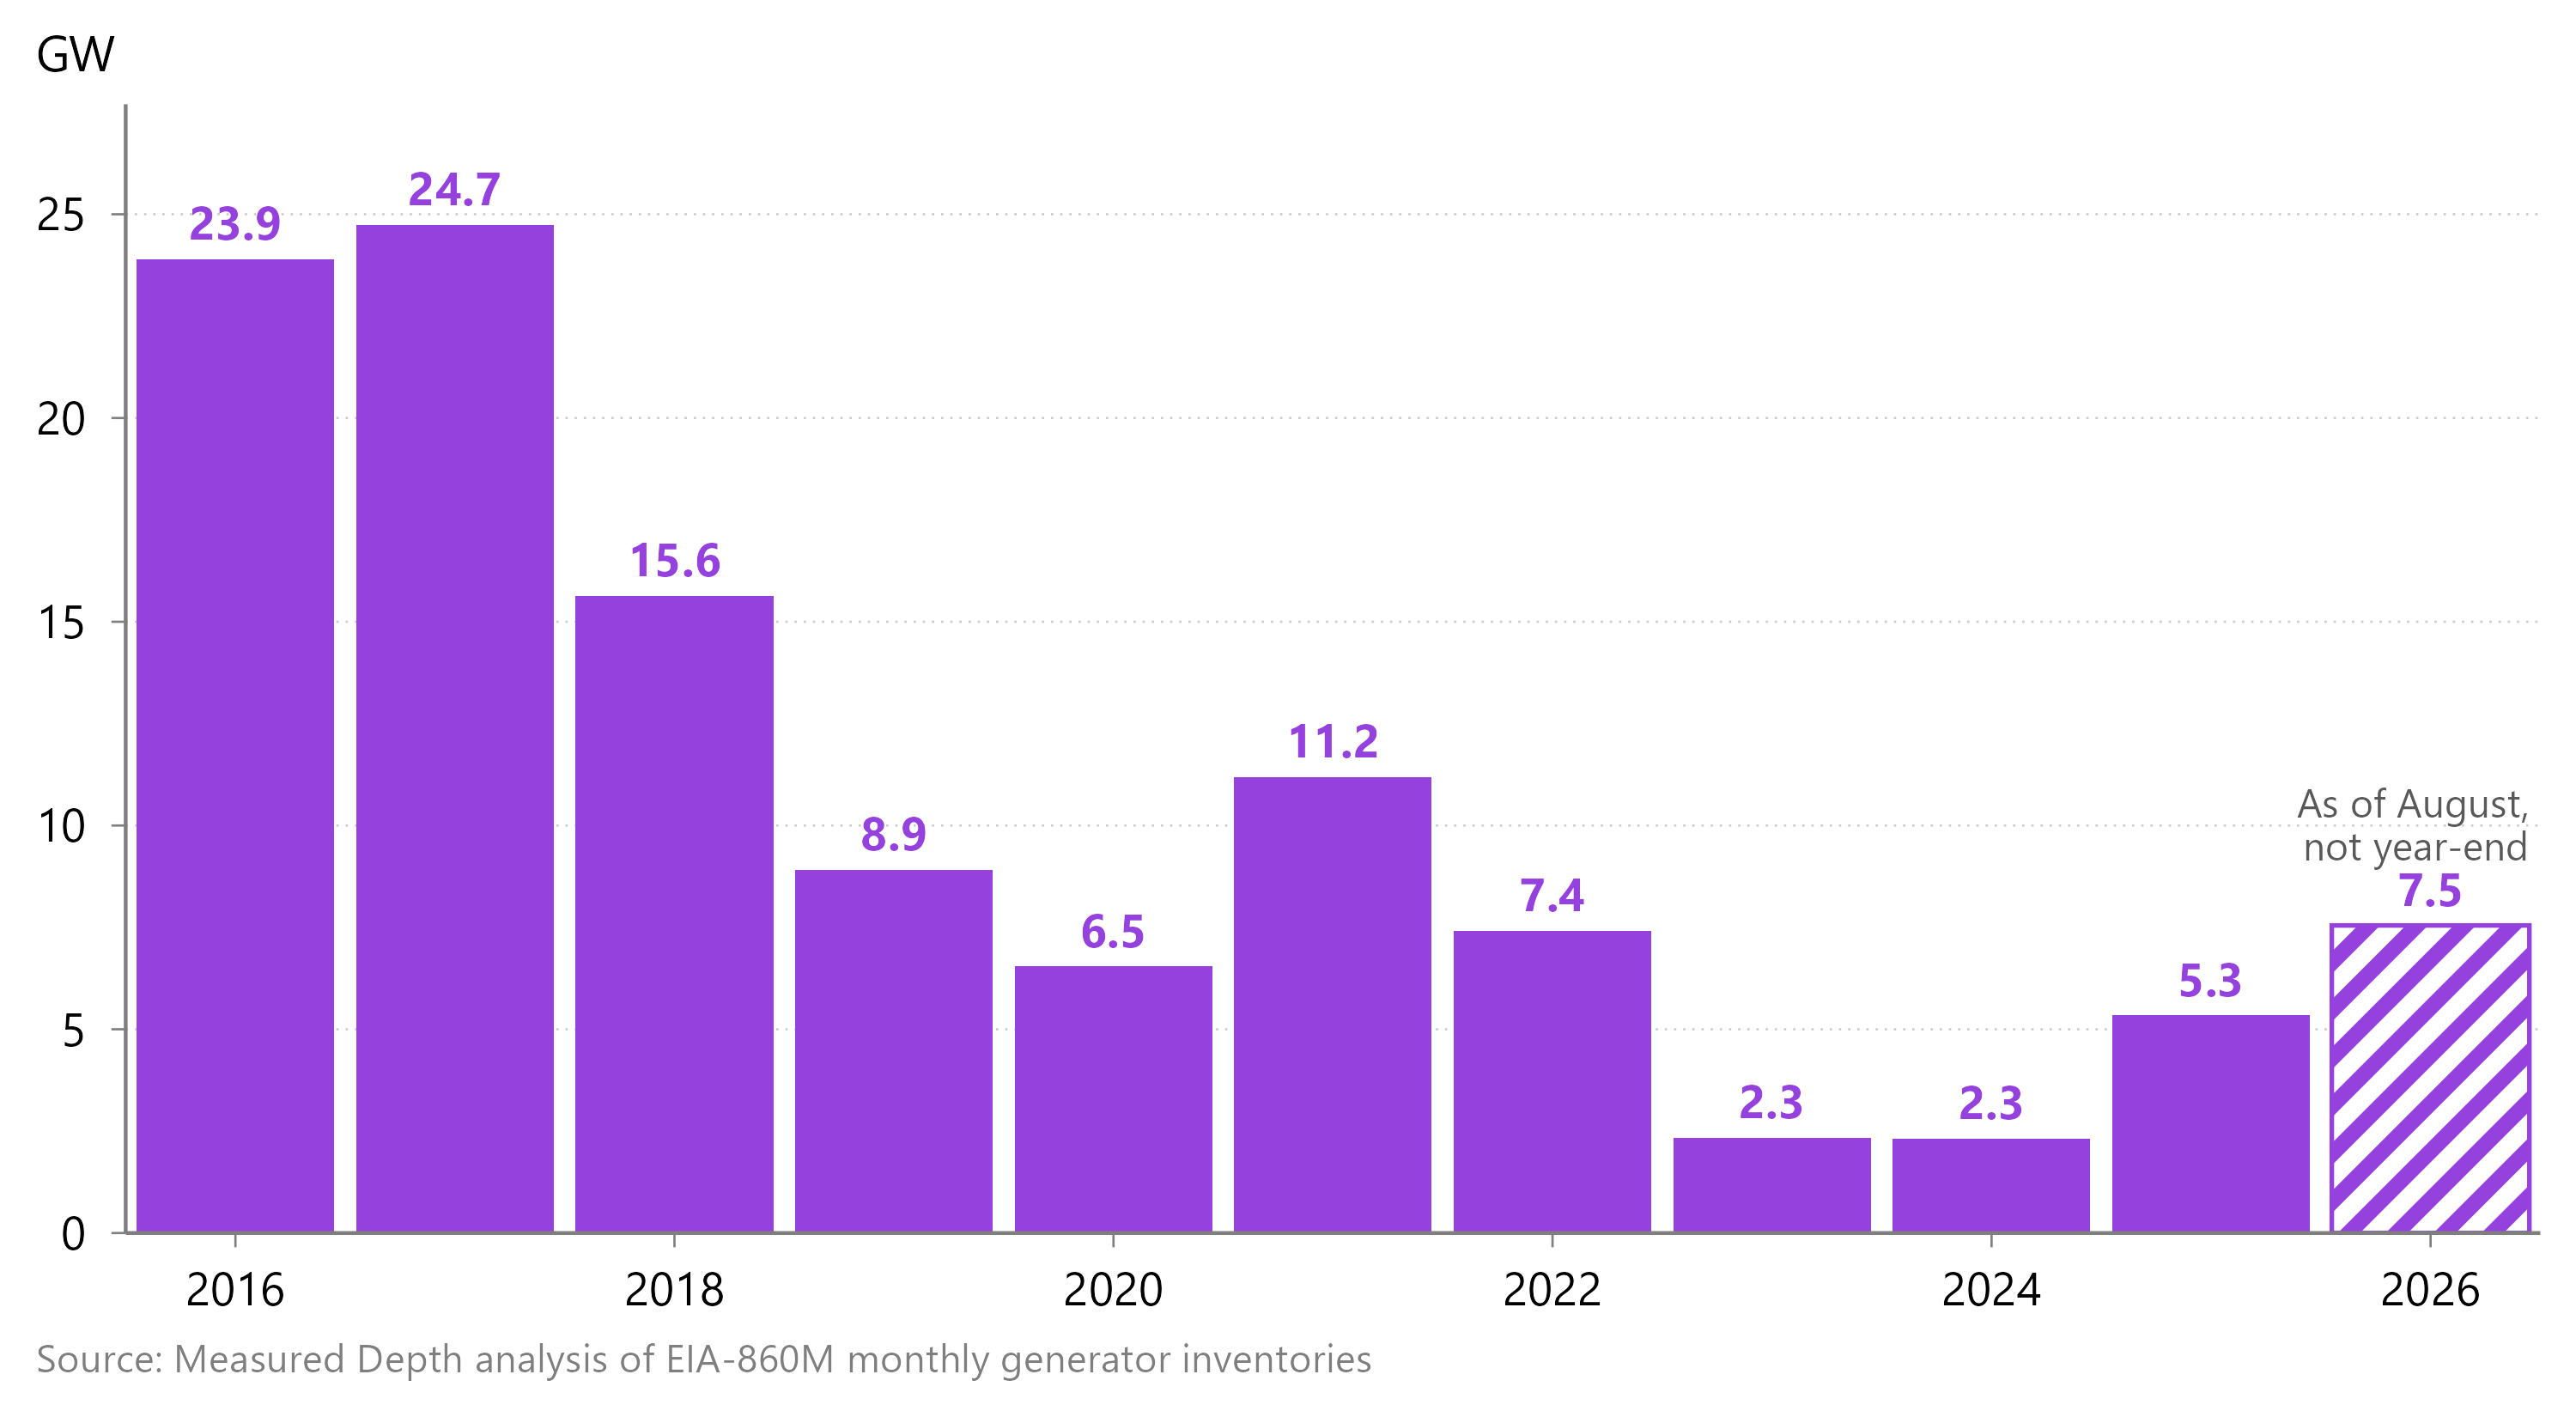
Those investments are now underway. Gas combined-cycle capacity under construction (teal bars in Figure 3) collapsed from ~25 GW in 2016-17 to ~2 GW in 2023-24, before recovering to ~7 GW by mid-2026. Although CCs are faster to build than liquefaction, they are still multi-year projects, meaning that CC additions are unlikely to accelerate until the second half of 2028.
Figure 3 | Gas CC capacity under construction at year-end
Gas price implications
The market is weak this year mainly because of production — I agree with that much. But I’m still not worried about sustained sub-$3/MMBtu prices, for three reasons:
The market isn’t that weak: the 12-month strip still trades ~$3/MMBtu. It almost never makes sense to talk about prompt prices for a seasonal commodity — especially one becoming more seasonal because storage is under-built — whether that’s the February contract at ~$7.50/MMBtu early this year or the November contract at ~$3/MMBtu now.
During E&Ps’ capex planning season last fall, 2026 futures at ~$4/MMBtu called for strong growth. Now, the 2027 strip trades at just ~$3.10/MMBtu. Strong growth at $4 doesn’t worry me; strong growth next year would.
Nothing this year rises to the level of the winter 2023-24 shock, but conditions have been modestly bearish: winter ran slightly mild, and Golden Pass kept slipping relative to the in-service date the market priced in last year.
In the medium term, gas-fired generation growth should accelerate again. Demand for artificial intelligence tokens is still rising, which points to continued fast load growth. Capacity trends will support gas burn too: solar and especially wind development are slowing now that subsidies are gone, and coal retirements should resume once CC capacity catches up. Across all sectors, US structural gas demand growth should peak in 2028.
Figure 4 | US structural gas demand growth by sector
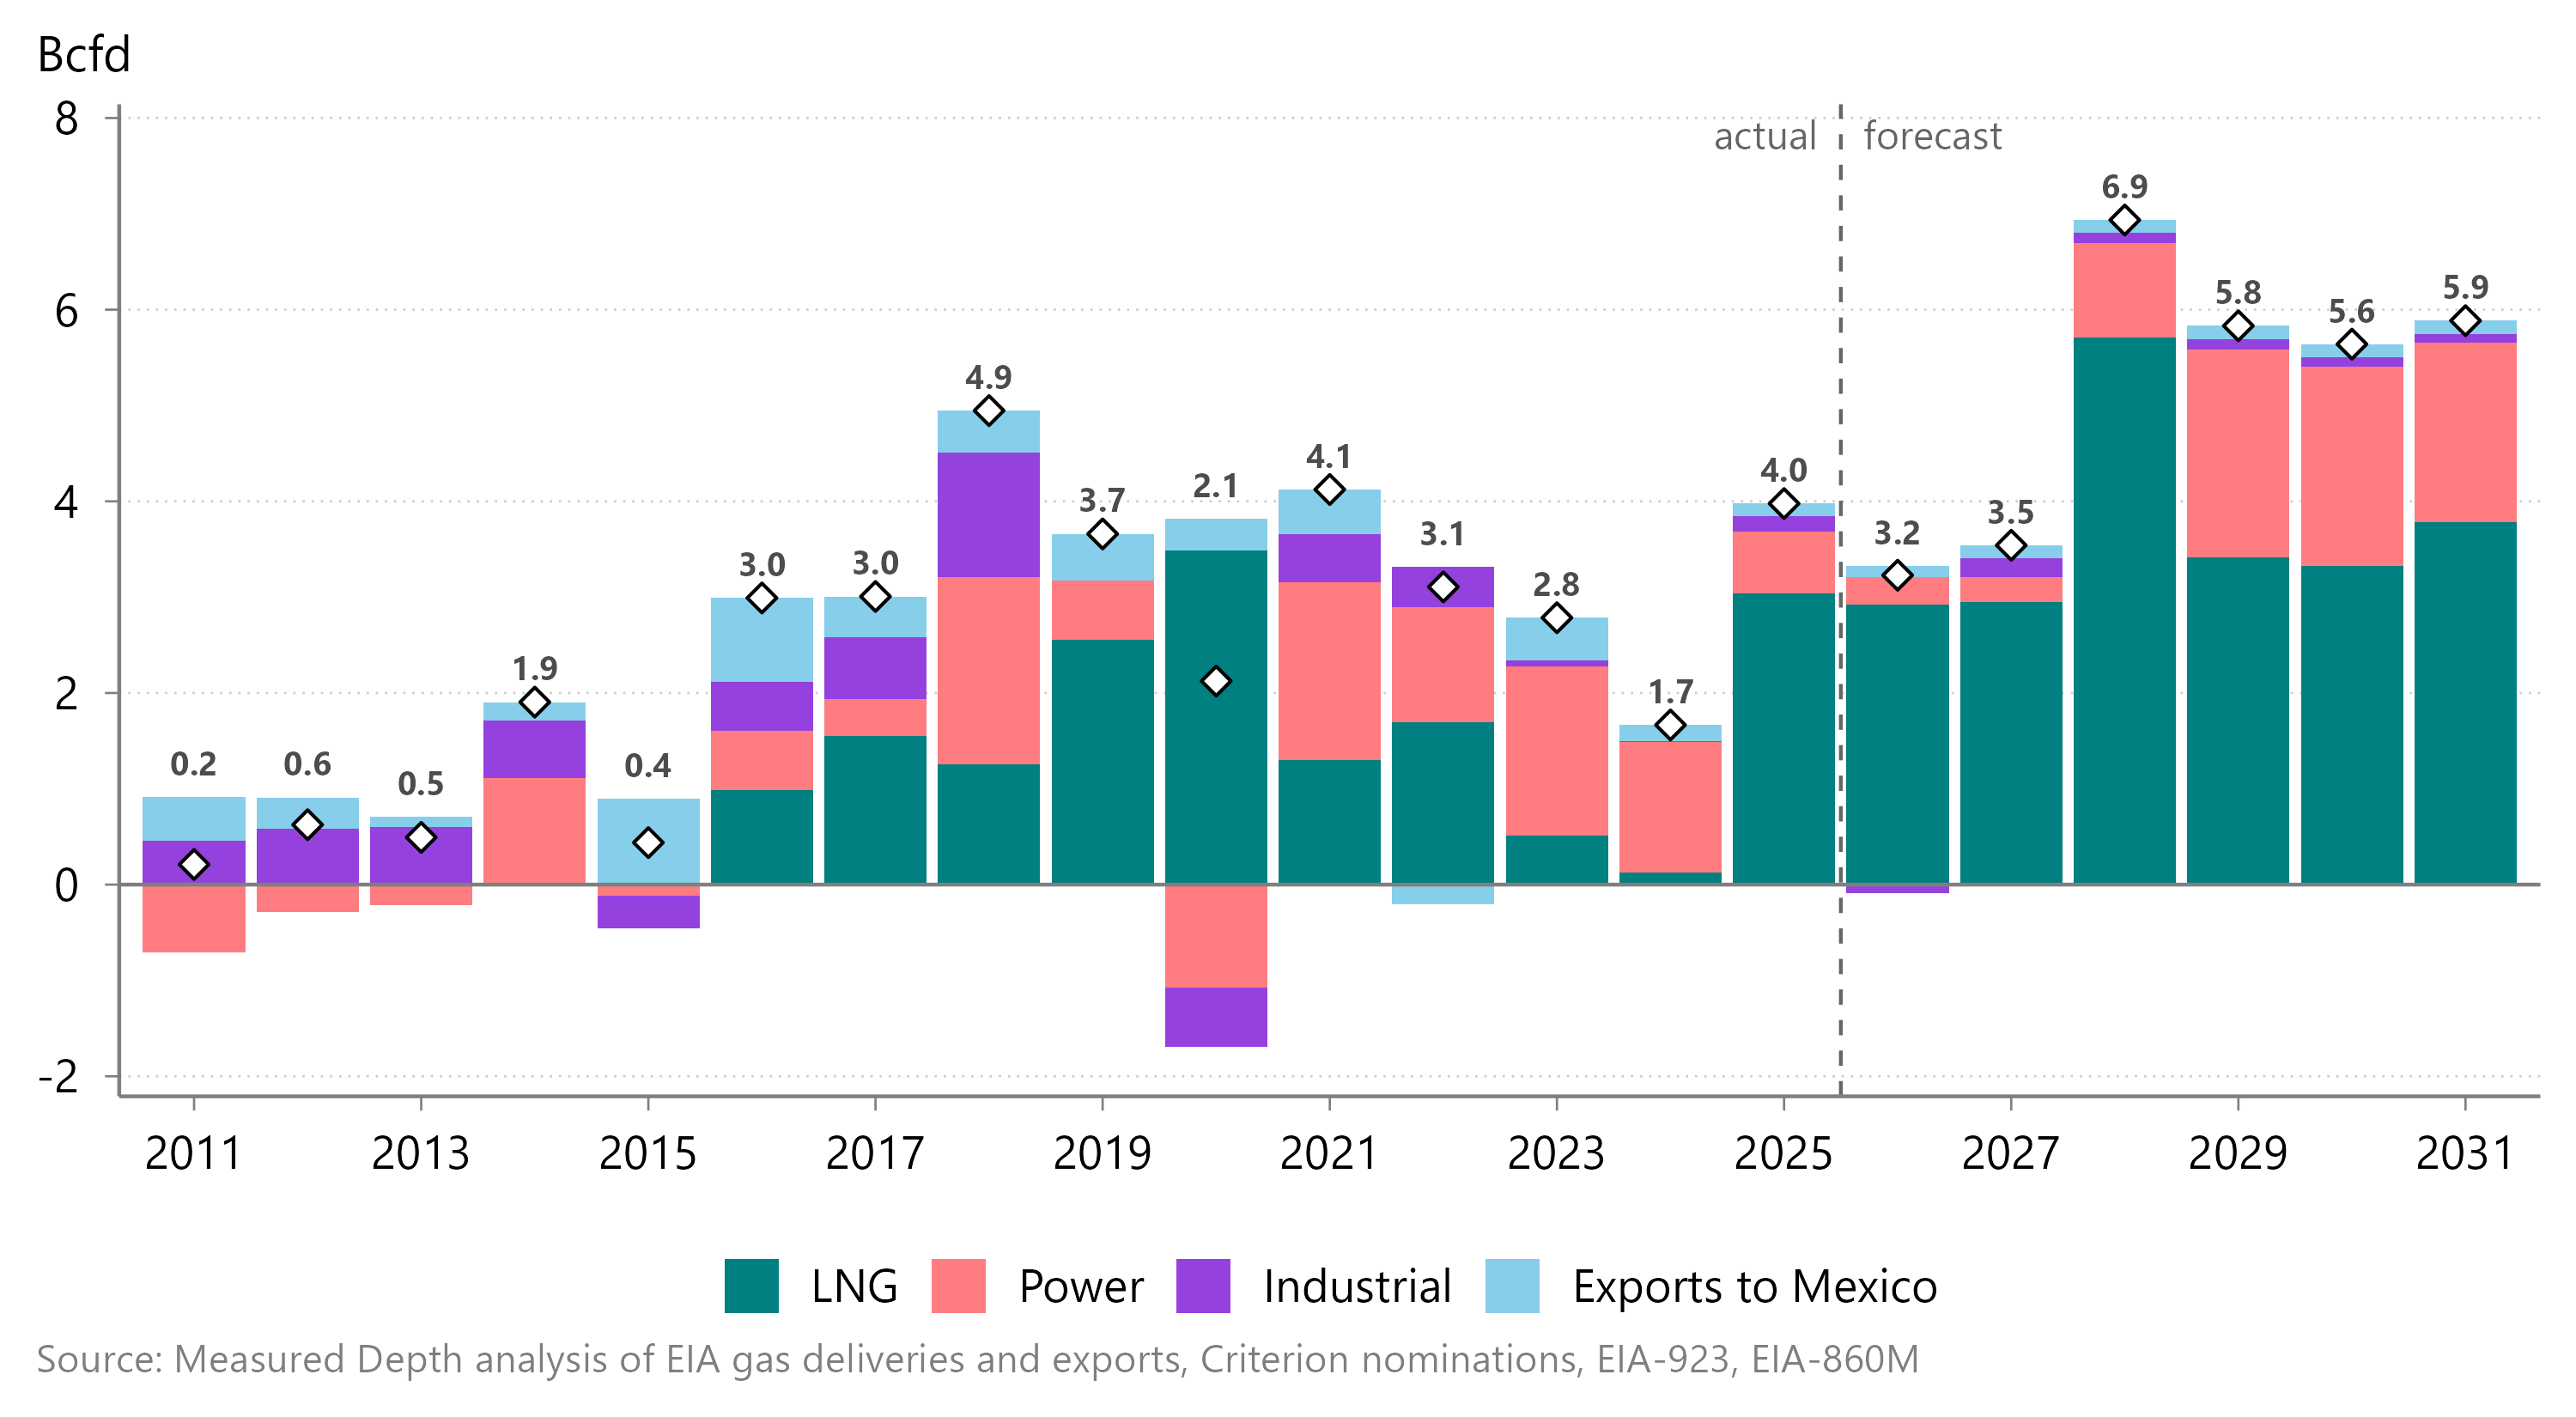
That single year matters less than the sustained 2028-31 pace: ~6 Bcfd annually across 2028-31, almost twice this year’s rate. In that 2028-31 period, each year’s demand growth is likely to exceed the record to date. Consecutive years of strong growth compound the challenge for E&Ps: every year of growth steepens the following year’s base decline. That means more capex just to hold production flat, before funding any growth on top — and therefore higher prices.
So yes, gas demand has picked up in 2025-26, from the anemic 2023-24 pace back to the typical 2016-22 rate. But the truly bullish demand thesis is underway only in capex; the demand itself is still two years out. And if the 2028 acceleration isn’t priced into the 2028 strip by next fall, when E&Ps set capital budgets, then the 2028 price move will look less like 2025’s structural shift upward and more like the 2021-22 spike.
Including Mexico, because these projects source US feedgas
More on this in a future post