
The credible gas-bull case
Haynesville drilling this year has moved even my mid-$4s Henry Hub view lower

Chronometer’s Matthew Smith argued on last week’s Invest Like the Best (and accompanying whitepaper) that accelerating US LNG exports and datacenter buildout could cause gas prices to “double or triple structurally,” kicking off a fresh round of debate on long-term Henry Hub prices.
I was never anywhere near that bullish; my own outlook called for Henry Hub prices reaching the mid-$4/MMBtu range by 2030. But an analyst’s job is to keep re-evaluating, and the evidence since then suggests I made the same error Chronometer did — underestimating elasticity — albeit on a much smaller scale. Given recent Haynesville activity levels, I now expect Henry Hub prices to rise to the low-mid $4s by 2030.
What is the purpose of this whitepaper (and media tour)?
After 18 years in this business, I can tell you that written research — even paid written research — is almost always a loss leader for something else, typically banking or software. Here it’s likely marketing, for raising additional capital and/or recruiting partners and analysts. In both cases, your incentive is to gain attention by positing interesting, thought-provoking ideas. In other words, to identify a real problem and sell it hard. If Henry Hub prices briefly go to $8/MMBtu and then settle at $4.50, Chronometer still looks great, even though that’s nowhere near a structural doubling or tripling.
What’s wrong with Chronometer’s analysis?
Energy FinTwit immediately and comprehensively documented the flaws1 in Chronometer’s analysis — even Kimmeridge’s Ben Dell weighed in — so I won’t rehash those here. (Kimmeridge itself is a good example of a firm that produces serious, deep research as a loss leader.)
At a high level, though, this analysis falls down by consistently understating elasticity — in gas supply, LNG exports, gas-fired generation, and gas pipeline development — and thereby overestimating the impact of real market changes (Figure 1). And then all of these overstated partial equilibria compound into an even more ridiculous general equilibrium: that Henry Hub prices will double or triple structurally.
Figure 1 | Chronometer’s claims and my views on them
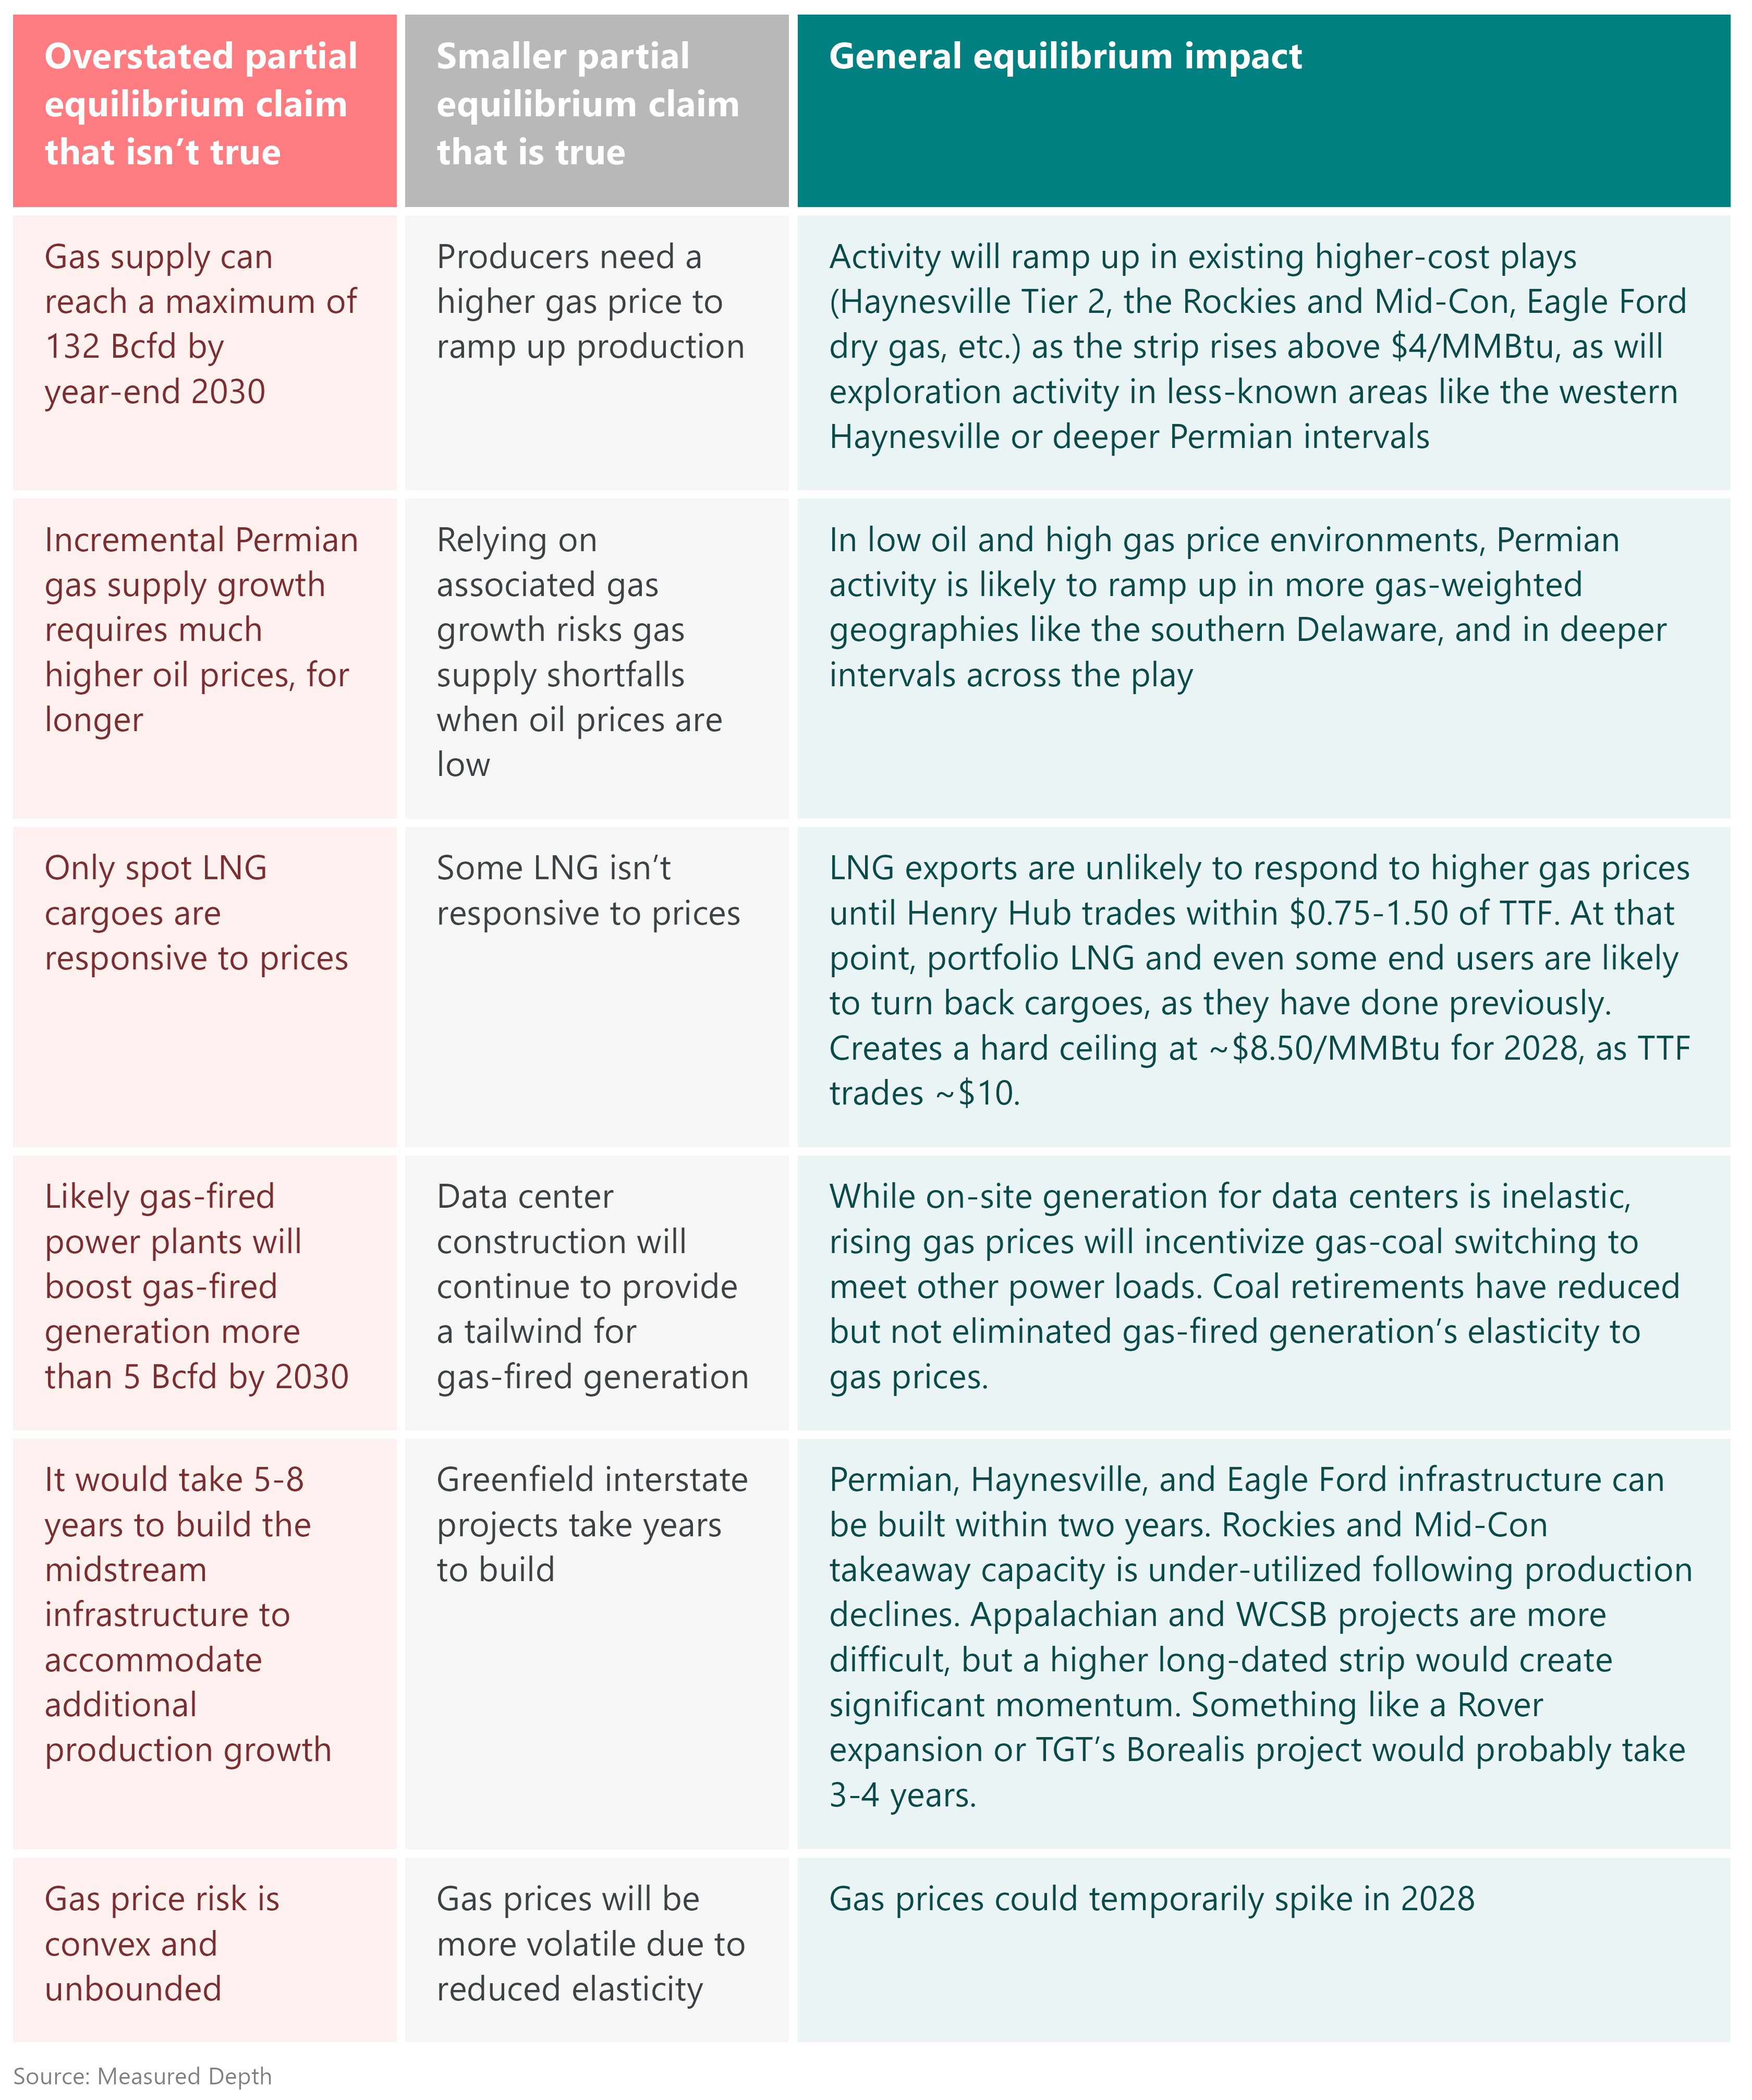
To be fair, Chronometer is right that complacency about long-term gas prices itself increases the odds of a spike, that Silicon Valley is taking gas-price risk lightly, and that rising gas and power prices are likely to become more politically salient. But it’s a long way from any of those to a structural doubling, which none of Chronometer’s analysis supports.
Why I was already getting less bullish
But even before Chronometer gave all of us gas bulls a worse name than we already had,2 market fundamentals had me reevaluating that mid-$4/MMBtu view. Starting in mid-2025, weather-adjusted gas-fired generation flattened, while production growth accelerated despite modest prices. The former is likely transient, but I am revising my thinking on prices based on the latter — and I’ll take each in turn.
Gas-fired generation: likely to accelerate over the next year
So far this year, gas-fired generation is roughly flat year-on-year, after normalizing for gas prices and fossil generation levels (Figure 2). The slowdown in coal retirements has ended a long-term tailwind for gas burn.
Figure 2 | Year-over-year change in gas-fired generation
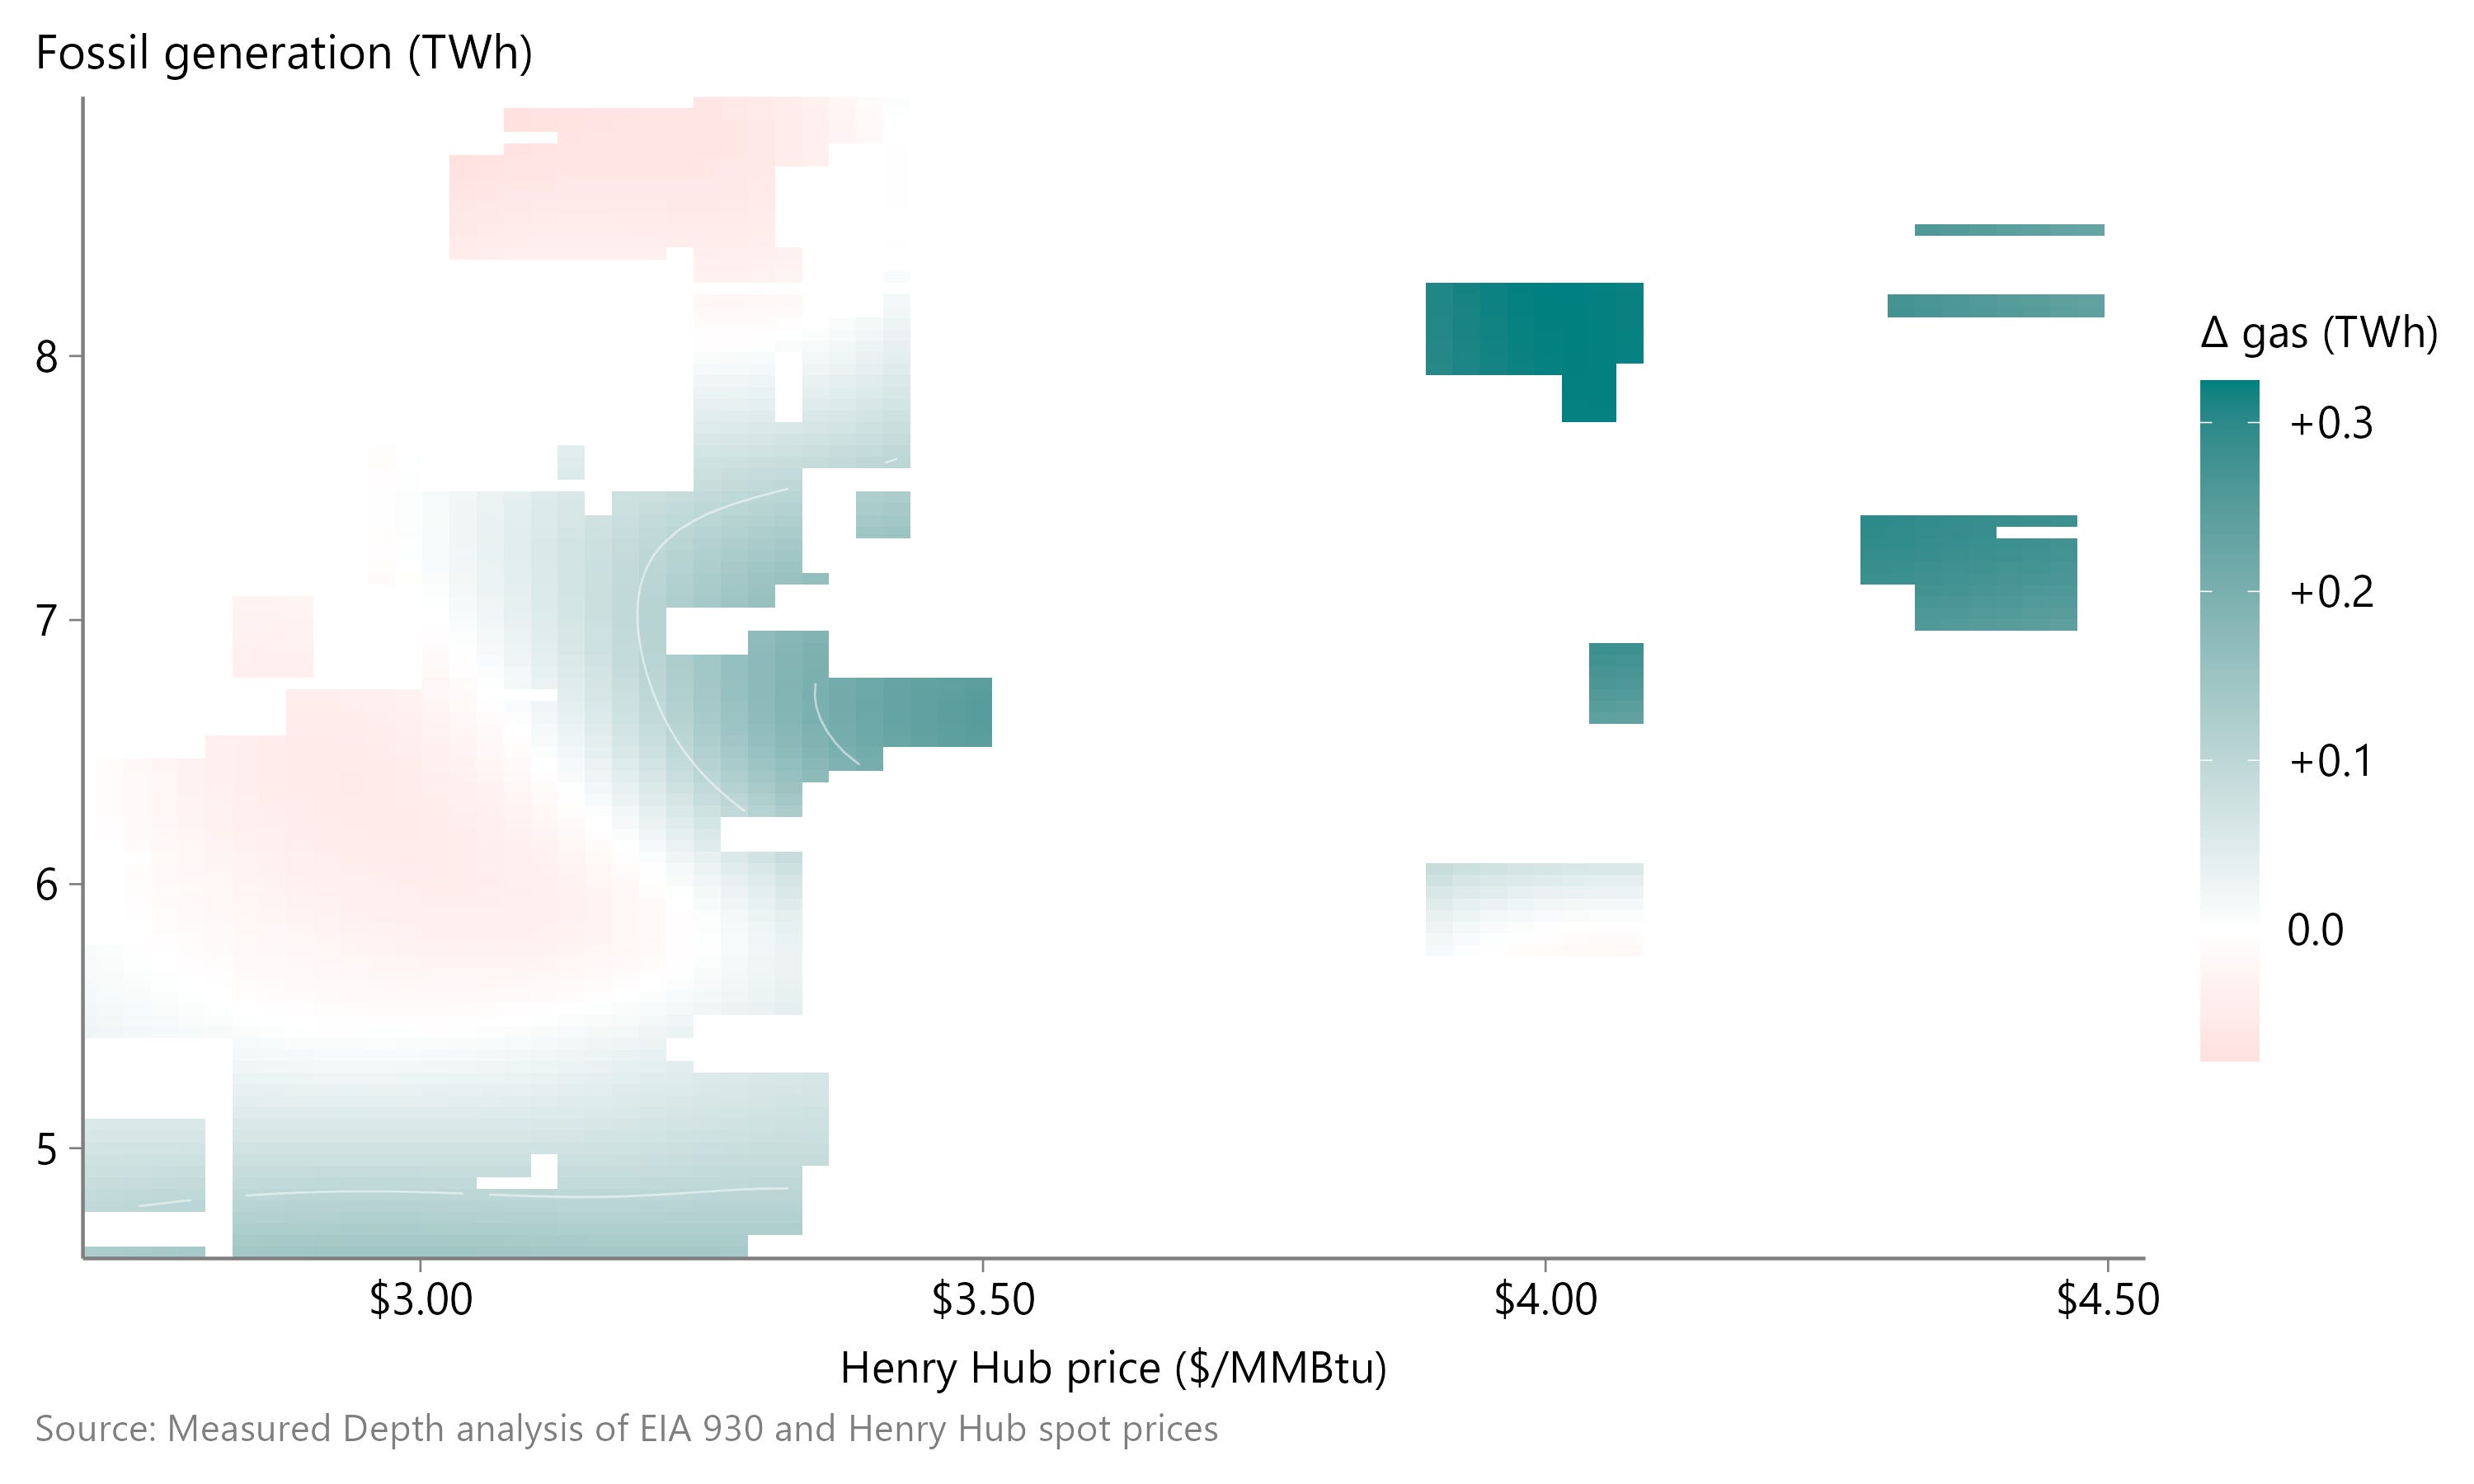
But while gas’s competitiveness with coal (holding gas prices constant) is unlikely to shift much in the short or medium term, fundamentals for fossil generation look stronger. Data-center development is diffuse and opaque, so it’s hard to know exactly why total generation levels slowed in the first half of this year after accelerating sharply in 2023-25. But hyperscalers (Microsoft and Google) and frontier labs (OpenAI and Anthropic) all point to a common explanation: demand for AI tools outstrips computing capacity.
I expect that weakness in load growth from mid-2025 through 1Q26 reflected constraints on data-center capacity, and that load growth is likely to accelerate as new capacity comes online. Some evidence of this is already visible in US power data: weather-normalized generation since April has grown at a ~1.5% annualized rate, up from ~0.4% over the prior three quarters.
Figure 3 | Weather-normalized run-rate US electricity generation (30-day MA)
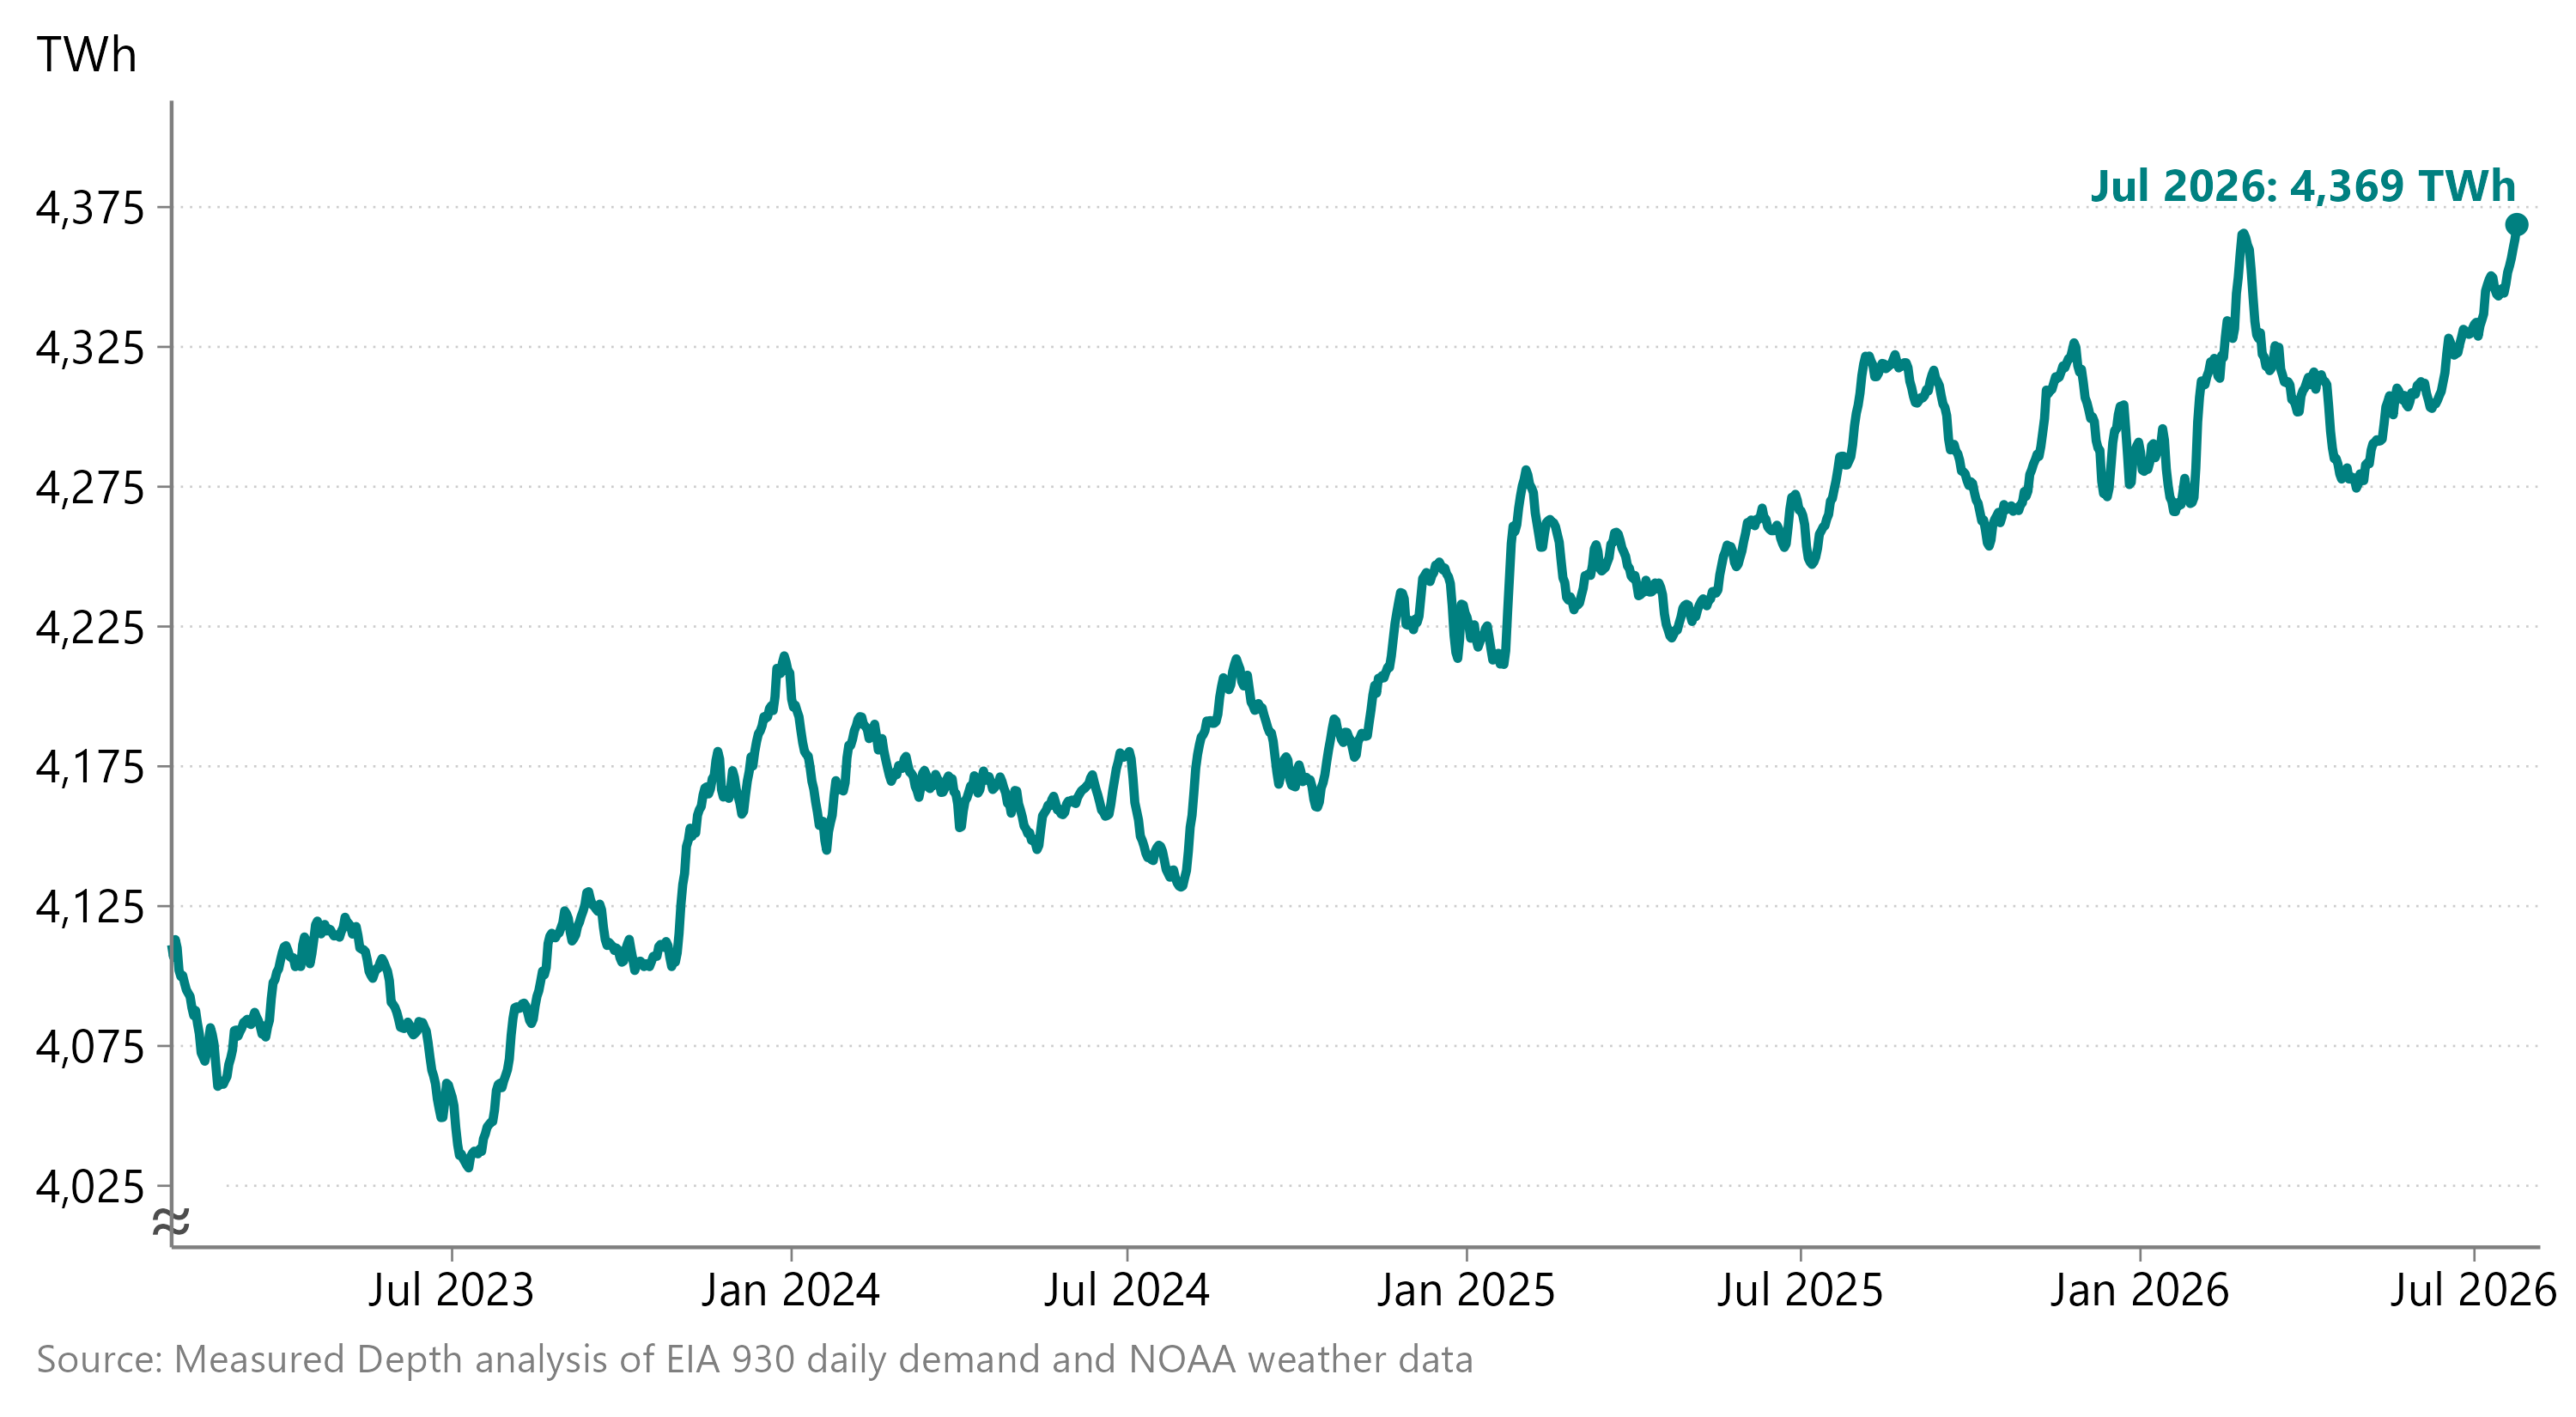
Add in a decelerating solar build following the tax-credit phase-out, and I’m not worried about medium-term fundamentals for gas-fired generation, even though gas burn this year has been weak.
Haynesville activity: stronger than I expected
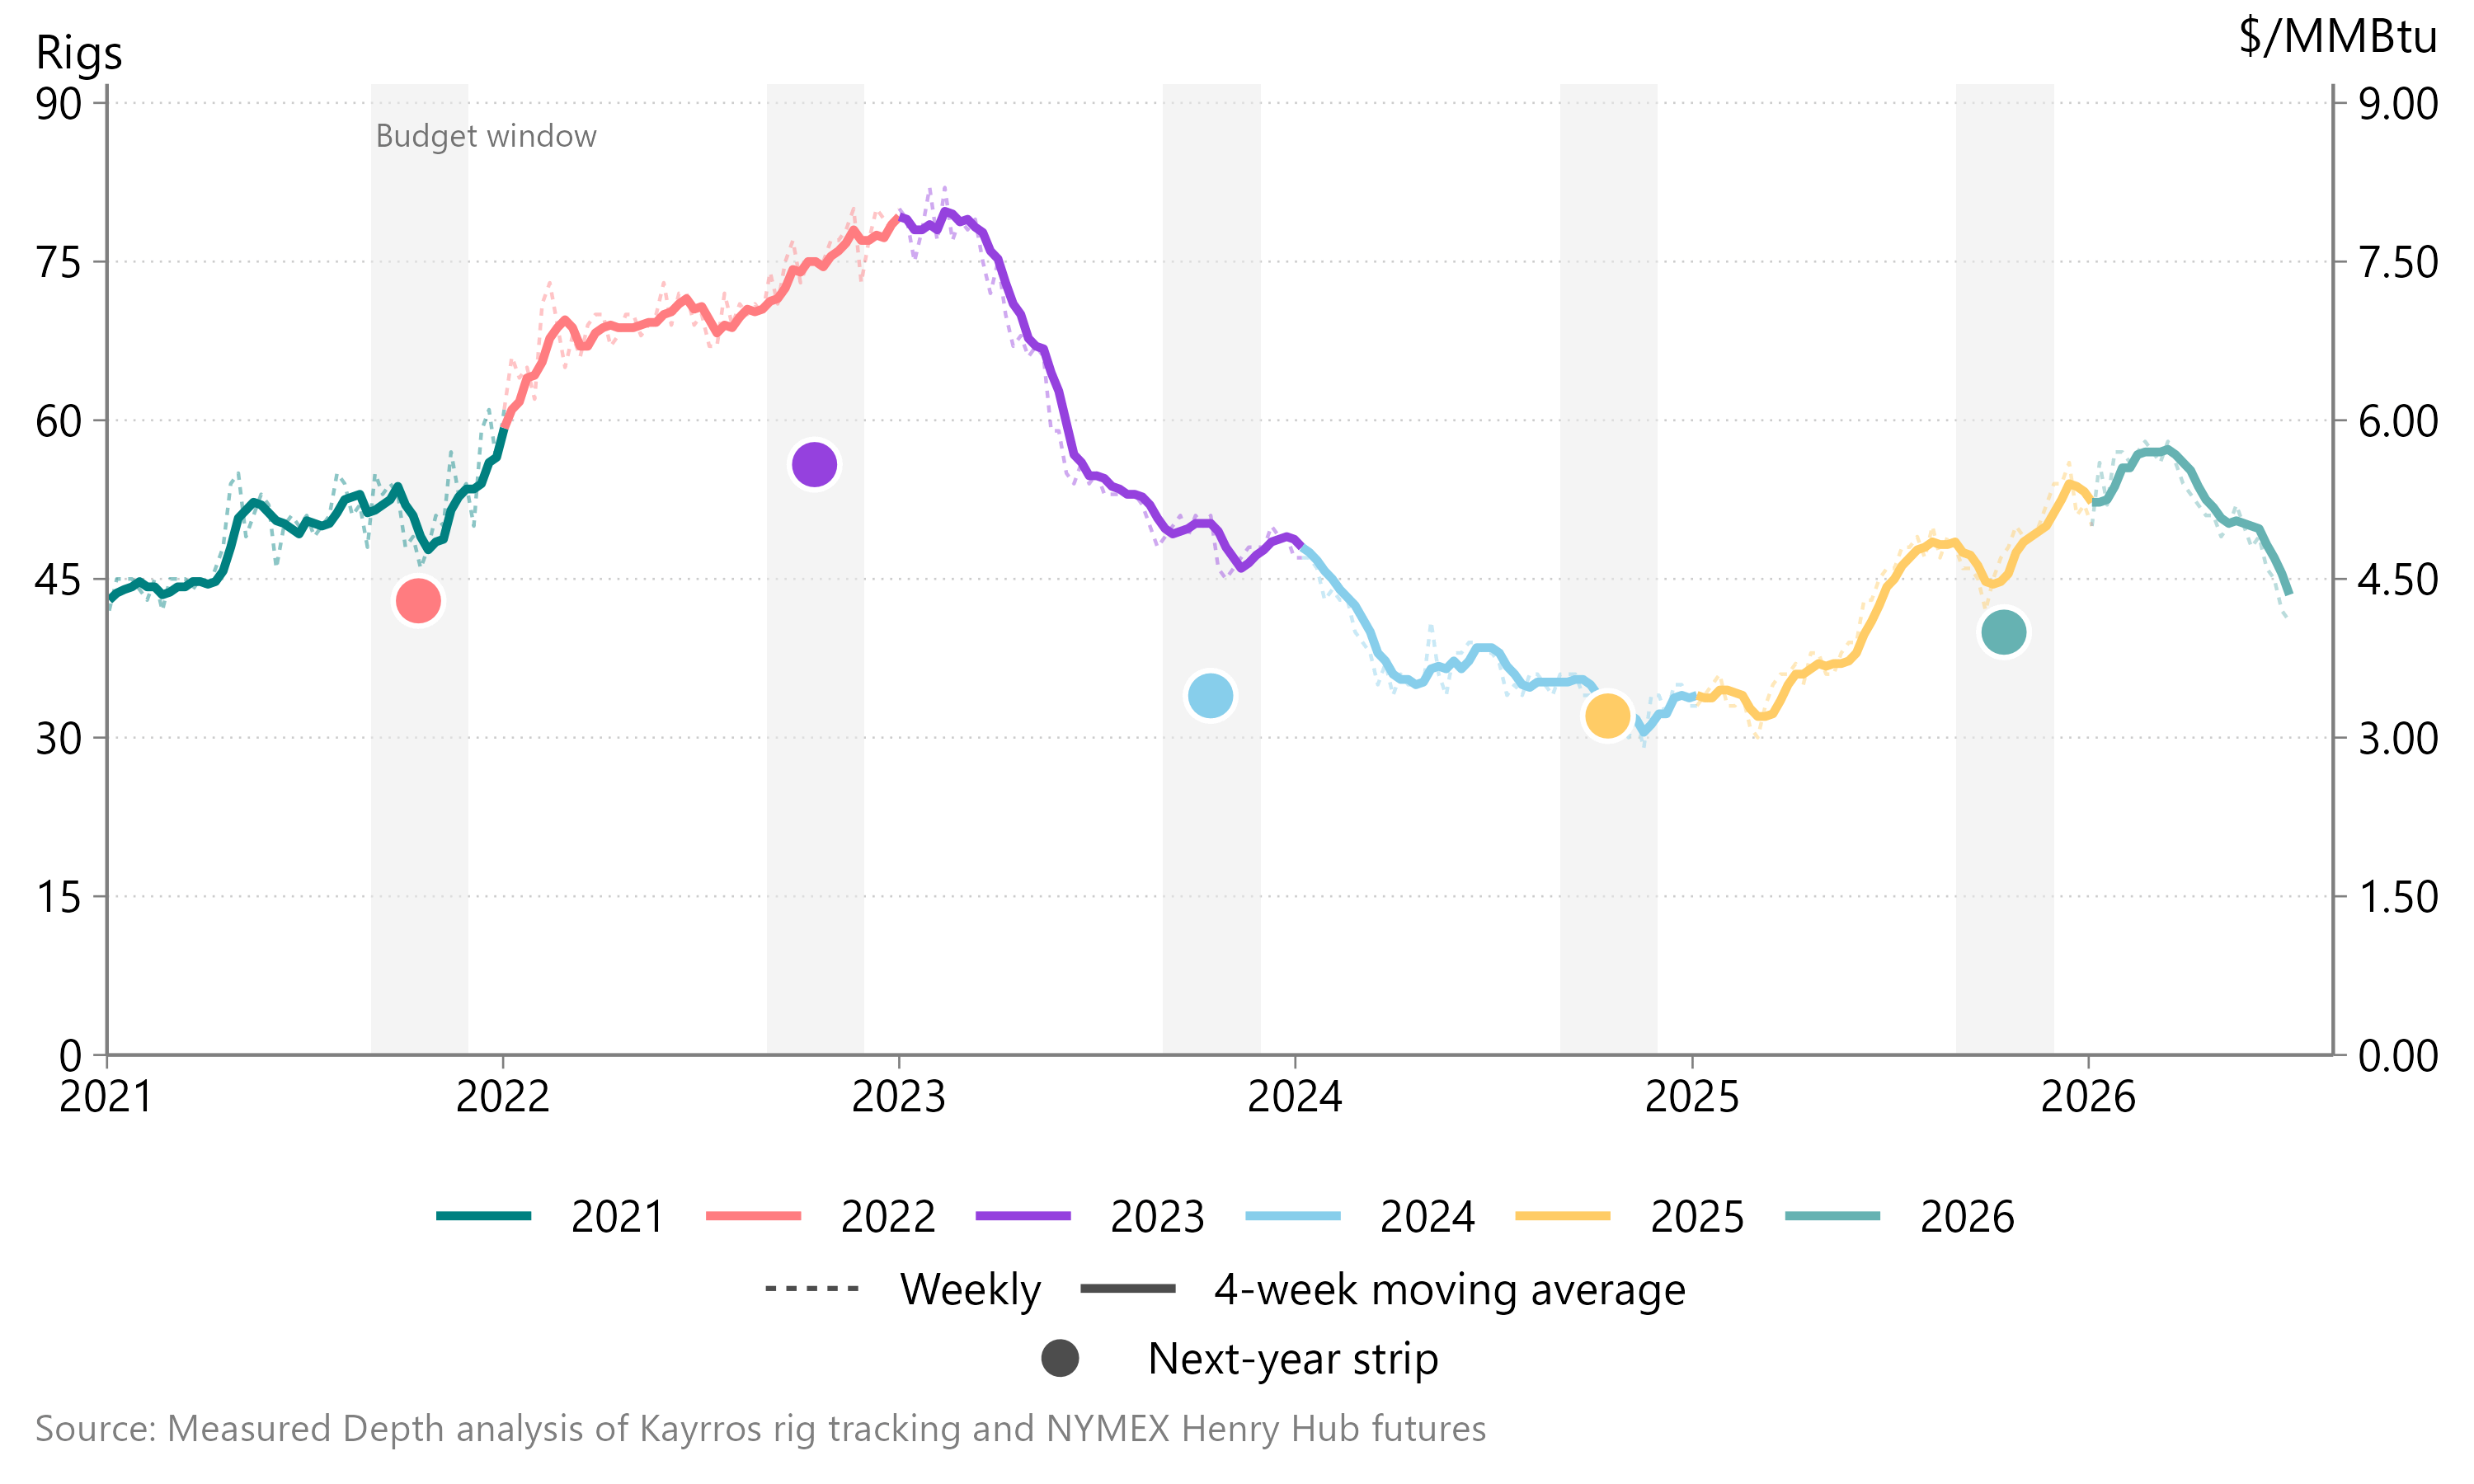
Permian gas production growth filling available takeaway capacity this summer is unsurprising, and still consistent with a bullish long-term view. But ~2.4 Bcfd of Haynesville gas production growth since September 2025 is more than I expected, as was the high-50s rig count in February-March.
However, the implications of these higher drilling levels are less severe than they seem at first glance. The currently active 41 rigs don’t necessarily mean that operators see that activity level as optimal relative to prompt-month prices of $2.75; rather, operators made those drilling decisions last fall, when the 2026 strip traded at ~$4. But the 52 rigs active on average so far this year do mean that operators saw $4/MMBtu as a sufficient price to ramp up Haynesville drilling and production, which is a lower threshold than I expected (and lower than major operators guided).
Figure 4 | Haynesville activity and year-ahead Henry Hub prices
Implications for long-term gas prices
Since I wrote about my bullish view last fall, the 2027-30 Henry Hub strip has sold off from ~$3.85/MMBtu to $3.60. Given this year’s stronger-than-expected Haynesville activity, I’d fade my medium-term outlook by a similar amount, to the low-mid $4s.
In 2024-25, operators ran ~40 rigs following ~$3.25-3.50/MMBtu planning prices, so I expect a similar 2027 Haynesville activity level with the 2027 strip at ~$3.40/MMBtu. With Haynesville drilling already down to an average of 45 rigs in June, this seems likely — but if it’s not, I’ll need to revise further.
To those, I’d add a couple more: the demand-outlook table cites the EIA as a source but doesn’t tie out with EIA historic values, and the forecast residential/commercial/industrial growth is both outlandish and never explained.
Undeservedly, I’d argue! I’ve been hearing the same arguments since 2019 about how it’s crazy to be bullish on long-term gas prices, even though the curve re-rated upward by $0.75/MMBtu over that period.